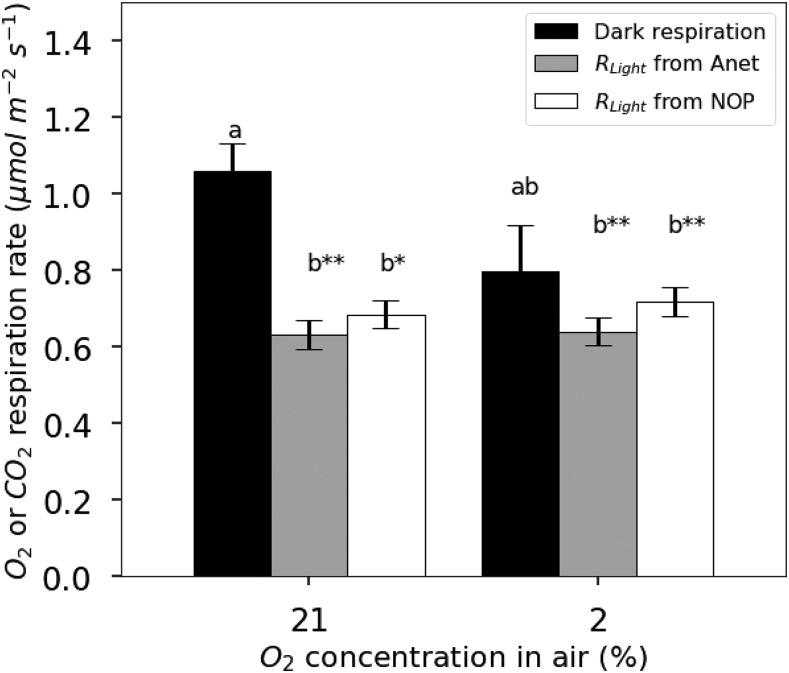
Figure 5.
Comparison of respiration rates measured in the dark (black bars) and apparent respiration rate in the light using the Kok method on Anet (gray bars) or using the Kok method on NOP (white bars) for French bean leaves exposed to 21% O2 or 2% O2. Values of RLight were corrected for variations in Ci. Results of Student’s t test are represented by double asterisks when the difference from the other group is very significant (P ≤ 0.01) and by single asterisks at P < 0.05. Each group is represented by a different letter, a or b. Error bars represent se for n = 3.

