Figure 2.
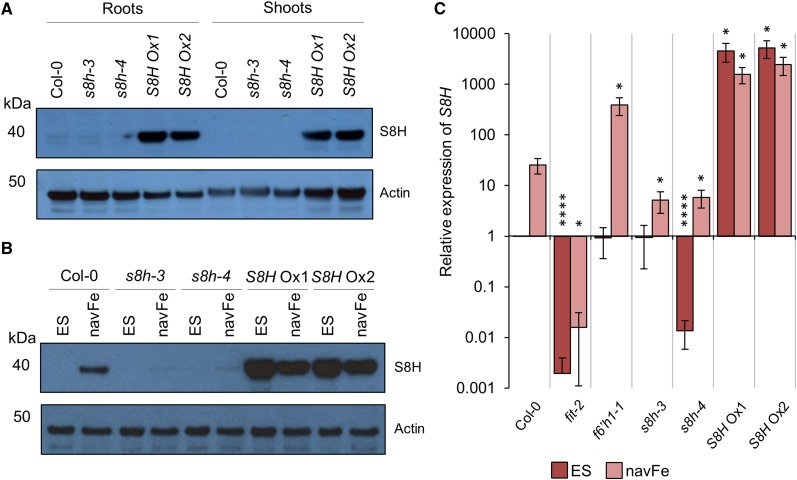
Expression of S8H protein and transcripts. A and B, Detection of S8H in protein extracted from 14-d-old Col-0, s8h-3, s8h-4, S8H Ox1, and S8H Ox2 plants by western-blot analysis. Actin abundance is shown in each panel as a control for equal protein loading. Representative images of three independent experiments are shown. A, Total protein extracted from roots and shoots of plants grown on ES media. Per lane, 10 μg of total protein was loaded. B, Total protein extracted from roots of plants grown on either ES or navFe media. Per lane, 2.5 μg of total protein was loaded. C, RT-qPCR analysis of S8H expression in root samples from Col-0, fit-2, f6’h1-1, s8h-3, s8h-4, S8H Ox1, and S8H Ox2 plants grown for 14 d on either ES or navFe media. The ΔΔCT method was used to determine relative gene expression, and expression of elongation factor 1 alpha was used as an internal control. Each bar represents the mean ± se of three independent experiments. Statistical testing was carried out using Student’s t test. Asterisks indicate significant differences from the wild type (Col-0) in each treatment: *, P ≤ 0.05; ****, P ≤ 0.0001.

