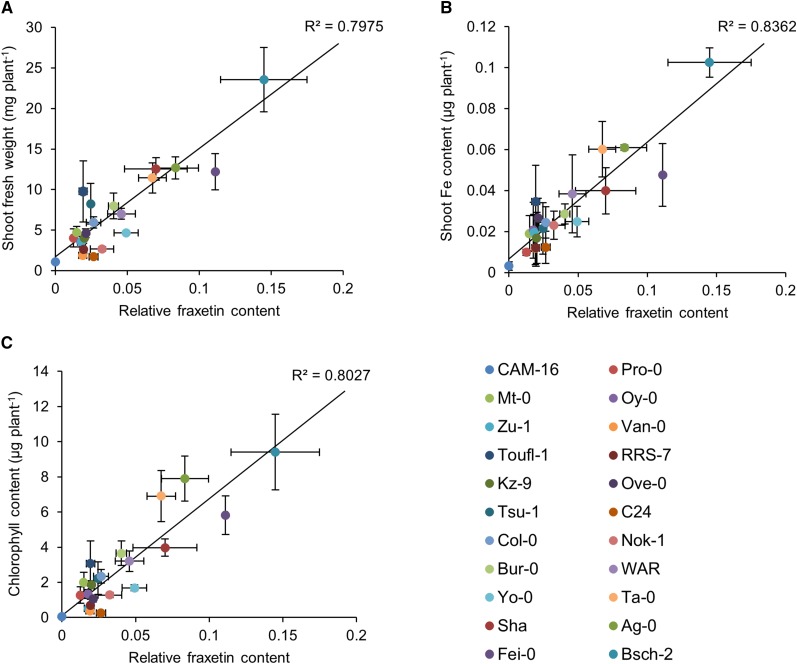
Figure 5.
Correlation analysis between the growth performance and the relative fraxetin content in 22 different Arabidopsis accessions. Plants were grown on navFe media for 14 d. Linear regression analysis was carried out by plotting shoot fresh weight (A), shoot Fe content (B), and chlorophyll content (C) of each accession against their relative fraxetin content.

