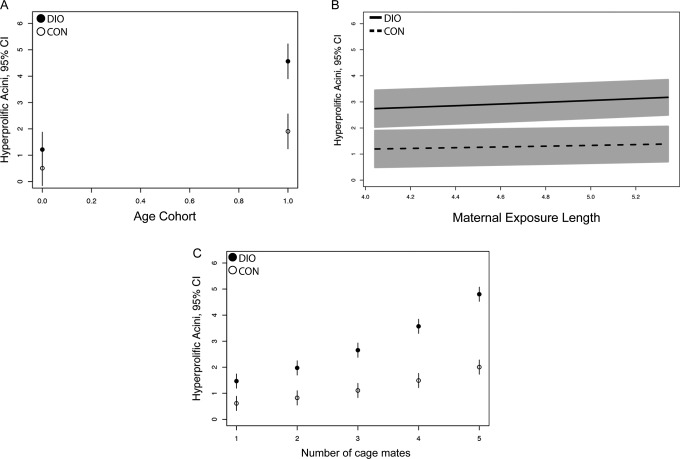
Figure 1.
Graphical predictions of prostate hyperplasia outcomes for 3 covariates from the generalized linear model (GLM). A, Age cohorts are graphed bimodally, representing members of the young cohort (16 weeks, 0) or old cohort (26 and 63 weeks, 1). B, Hyperplasia counts predicted relative to maternal (high sugar/high fat) exposure length (graphed in months). C, Predicted hyperplasia counts relative to the number of littermates in the cage with the subject. In all panels, means and 95% confidence intervals (CI) are plotted.

