Figure 4.
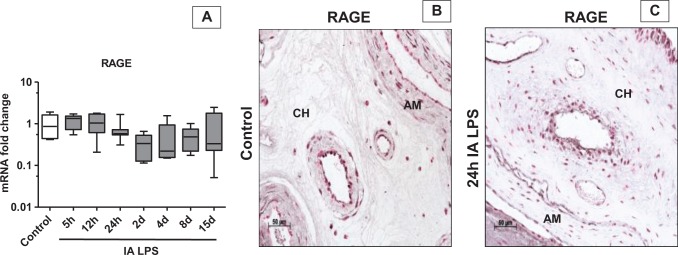
Expression of RAGE did not increase in fetal membranes after IA LPS exposure: data for (A) are shown as box (25th-75th percentile) and whisker (10th-90th percentile) plot with horizontal line in each box depicting the median. Expression of RAGE messenger RNA (mRNA) by quantitative reverse transcription-polymerase chain reaction (RT-PCR) showed no change throughout the time course (A). Representative photomicrographs (20× objective) of immunohistochemistry for RAGE showed staining of the amnion (AM) and chorion (CH) in control (B) and 24 hours after IA LPS exposure (C) but there were no differences in the LPS-exposed animals compared to control. IA indicates intra-amniotic; LPS, lipopolysaccharide; RAGE, receptor-advanced glycation end product

