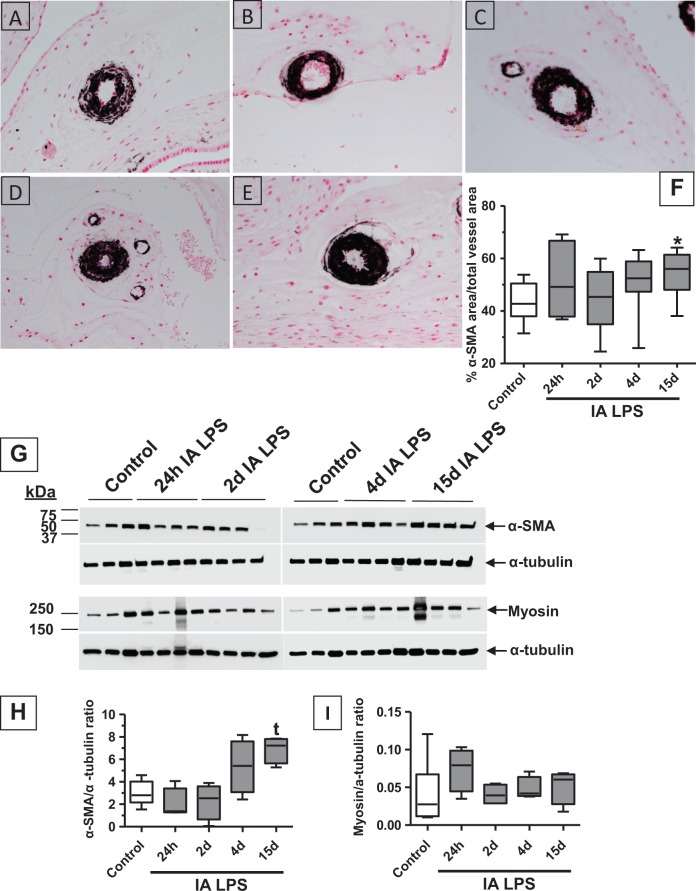
Figure 6.
Chorion arteriolar smooth muscle hypertrophy after IA LPS exposure: representative photomicrographs (40× objective) of immunohistochemical staining for α-SMA showed expression in the vascular smooth muscle of chorion arteriole in control (A), with increased expression 15 days after IA LPS (E). Data for (F), (H), and (I) are shown as box (25th-75th percentile) and whisker (10th-90th percentile) plot with horizontal line in each box depicting the median. Morphometric analysis of α-SMA staining in the vessel showed increased area of α-SMA expression relative to total vessel area 15 days after IA LPS exposure indicating smooth muscle hypertrophy (F). Western blot analysis of α-SMA showing a trend toward increased expression at 15 days after IA LPS (G-H) supporting the observations of smooth muscle hypertrophy. Western blot analysis of smooth muscle myosin heavy chain showed no significant changes in expression after IA LPS (G and I; *P < .05 compared vs control by Kruskal-Wallis nonparametric analysis of variance [ANOVA] with post hoc Dunn test and by nonparametric t test, t P < .05 compared vs control by nonparametric t test only). IA indicates intra-amniotic; LPS, lipopolysaccharide; SMA, smooth muscle actin.

