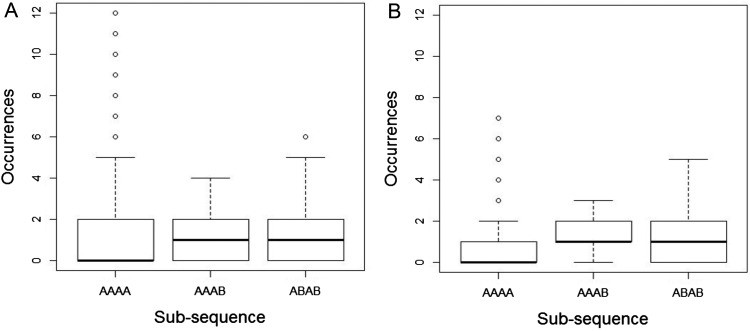
Figure 4.
The results of Analysis 4 for sliding window length 4. Boxplots illustrating medians Inter-Quartile Range (IQRs) and extreme values of the data illustrated in Figure 2 for three selected sequences. (A) theoretically unbiased (TU) data (truncated at frequency = 12). (B) Data for human observers.

