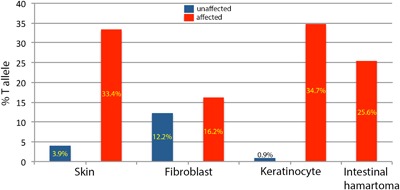
Figure 4.

Distribution of SMO c.1234C>T, p.Leu412Phe mutant T alleles in affected (red bars) and clinically unaffected (blue bars) tissues. Dermis and epidermis layers are represented by cultured fibroblasts and keratinocytes, respectively. [Color figure can be viewed at http://wileyonlinelibrary.com]
