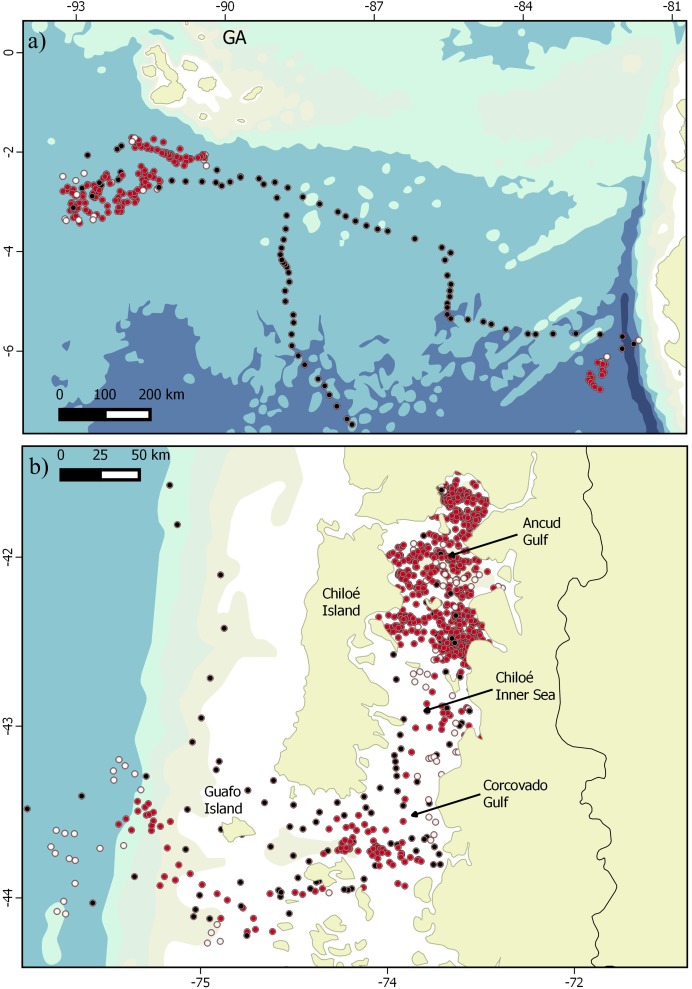
Figure 2. Transit and ARS behaviors shown by blue whales.
Fine scale locations of behavioral states shown by blue whales. (A) Zoomed view of GA where ARS behavioral mode (red dots) was observed; black dots indicate transit and white dots undetermined behavior. (B) View of the CNP where all whales are grouped using model 2 (sixth time-step). Note that (A) and (B) represent different spatial scales.

