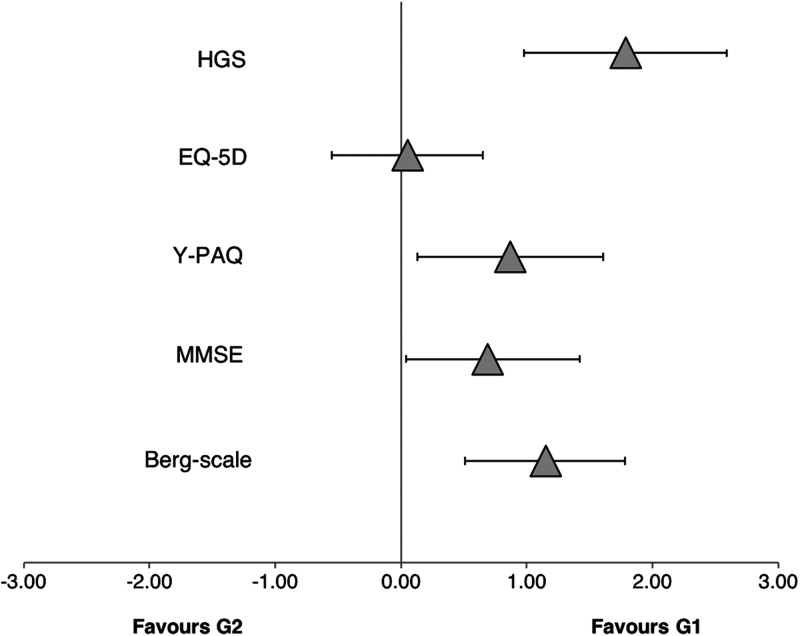
Figure 3. Standardized mean differences between scores.
Standardized mean differences (with 90% CI) between scores for the hand grip strength (HGS), the EQ-5D scale, the Yale Physical Activity Questionnaire (Y-PAQ), the Mini mental state examination (MMSE) and the Berg scale from the strongest (G1) and weaker (G2) participants.

