

Key Points
Question
Does the magnitude of reductions in total and cardiovascular mortality after low-density lipoprotein cholesterol (LDL-C) lowering depend on the baseline LDL-C level?
Findings
In this meta-analysis of 34 randomized clinical trials that included 270 288 participants, more intensive LDL-C–lowering therapy was associated with a progressive reduction in total mortality with higher baseline LDL-C levels (rate ratio, 0.91 for each 40-mg/dL increase in baseline level); however, this relationship was not present with baseline LDL-C levels less than 100 mg/dL. There was a similar relationship for cardiovascular mortality.
Meaning
The greatest benefit from LDL-C–lowering therapy may occur for patients with baseline LDL-C levels of 100 mg/dL or greater.
Abstract
Importance
Effects on specific fatal and nonfatal end points appear to vary for low-density lipoprotein cholesterol (LDL-C)–lowering drug trials.
Objective
To evaluate whether baseline LDL-C level is associated with total and cardiovascular mortality risk reductions.
Data Sourcesand Study Selection
Electronic databases (Cochrane, MEDLINE, EMBASE, TCTMD, ClinicalTrials.gov, major congress proceedings) were searched through February 2, 2018, to identify randomized clinical trials of statins, ezetimibe, and PCSK9-inhibiting monoclonal antibodies.
Data Extraction and Synthesis
Two investigators abstracted data and appraised risks of bias. Intervention groups were categorized as “more intensive” (more potent pharmacologic intervention) or “less intensive” (less potent, placebo, or control group).
Main Outcomes and Measures
The coprimary end points were total mortality and cardiovascular mortality. Random-effects meta-regression and meta-analyses evaluated associations between baseline LDL-C level and reductions in mortality end points and secondary end points including major adverse cardiac events (MACE).
Results
In 34 trials, 136 299 patients received more intensive and 133 989 received less intensive LDL-C lowering. All-cause mortality was lower for more vs less intensive therapy (7.08% vs 7.70%; rate ratio [RR], 0.92 [95% CI, 0.88 to 0.96]), but varied by baseline LDL-C level. Meta-regression showed more intensive LDL-C lowering was associated with greater reductions in all-cause mortality with higher baseline LDL-C levels (change in RRs per 40-mg/dL increase in baseline LDL-C, 0.91 [95% CI, 0.86 to 0.96]; P = .001; absolute risk difference [ARD], −1.05 incident cases per 1000 person-years [95% CI, −1.59 to −0.51]), but only when baseline LDL-C levels were 100 mg/dL or greater (P < .001 for interaction) in a meta-analysis. Cardiovascular mortality was lower for more vs less intensive therapy (3.48% vs 4.07%; RR, 0.84 [95% CI, 0.79 to 0.89]) but varied by baseline LDL-C level. Meta-regression showed more intensive LDL-C lowering was associated with a greater reduction in cardiovascular mortality with higher baseline LDL-C levels (change in RRs per 40-mg/dL increase in baseline LDL-C, 0.85 [95% CI, 0.80 to 0.91]; P < .001; ARD, −1.0 incident cases per 1000 person-years [95% CI, −1.51 to −0.45]), but only when baseline LDL-C levels were 100 mg/dL or greater (P < .001 for interaction) in a meta-analysis. Trials with baseline LDL-C levels of 160 mg/dL or greater had the greatest reduction in all-cause mortality (RR, 0.72 [95% CI, 0.62 to 0.84]; P < .001; 4.3 fewer deaths per 1000 person-years) in a meta-analysis. More intensive LDL-C lowering was also associated with progressively greater risk reductions with higher baseline LDL-C level for myocardial infarction, revascularization, and MACE.
Conclusions and Relevance
In these meta-analyses and meta-regressions, more intensive compared with less intensive LDL-C lowering was associated with a greater reduction in risk of total and cardiovascular mortality in trials of patients with higher baseline LDL-C levels. This association was not present when baseline LDL-C level was less than 100 mg/dL, suggesting that the greatest benefit from LDL-C–lowering therapy may occur for patients with higher baseline LDL-C levels.
This meta-analysis of randomized trials compares reductions in all-cause and cardiovascular mortality achieved with more vs less intensive LDL cholesterol lowering stratified by baseline LDL level.
Introduction
Consistent evidence has shown that statins reduce total cardiovascular events, and that further lowering of low-density lipoprotein cholesterol (LDL-C) levels by intensifying statin therapy, adding ezetimibe, or adding a proprotein convertase subtilisin/kexin type 9 (PCSK9)-inhibiting monoclonal antibody provides incremental additional reduction in cardiovascular risk.1,2,3,4,5,6 However, there is less consistency in the magnitude of the reductions in individual mortality and cardiovascular end points among the various trials. Total and cardiovascular mortality benefits were observed in several placebo-controlled statin cardiovascular outcomes trials as well as in meta-analyses of statin trials.1,7,8,9 In contrast, no reduction in cardiovascular mortality was observed in 5-year trials of moderate- vs high-intensity statin therapy or in trials of ezetimibe or evolocumab added to background statin therapy.2,3,10,11,12 Understanding differences in treatment effects across clinical trials may influence estimates of treatment benefit, have an important effect on guideline recommendations and clinical trial design, and has already had a significant influence on cost-effectiveness analyses and accessibility decisions.13,14,15
Over time, baseline mean or median LDL-C levels progressively decreased from 188 mg/dL (4.87 mmol/L) in the first statin cardiovascular outcomes trial7 to 92 mg/dL (2.38 mmol/L) in a cardiovascular outcomes trial of evolocumab added to background statin therapy.3 Differences in LDL-C–lowering efficacy also influenced the magnitude of LDL-C reductions occurring across this broad range of baseline LDL-C levels.2,3,7 Therefore, the aim of this systematic review and meta-analysis was to determine whether baseline LDL-C level or the magnitude of LDL-C lowering with use of statins, ezetimibe, and PCSK9-inhibiting monoclonal antibodies were associated with reductions in fatal and nonfatal cardiovascular events.
Methods
Established methods recommended by the Cochrane Collaboration were used to conduct the meta-analysis.16 The findings were reported according to the PRISMA (Preferred Reporting Items for Systematic reviews and Meta-Analyses) statement.16,17 Methods are reported in full in eTable 1 in the Supplement. The following databases were searched: Cochrane Central Register of Controlled Trials, MEDLINE, EMBASE, TCTMD (https://www.tctmd.com/), ClinicalTrials.gov, Clinical Trial Results (http://www.clinicaltrialresults.org), and major congress proceedings, from database inception date through February 2, 2018.
The main inclusion criteria were (1) randomized trials including at least 1000 patients receiving the allocated pharmacologic LDL-C–lowering strategy for a minimum of 48 weeks; (2) use of statin, nonstatin, or statin in combination with nonstatin therapies (either ezetimibe or a PCSK9-inhibiting monoclonal antibody); and (3) reported cardiovascular and mortality outcomes of interest. Trials performed in populations with heart failure or end-stage renal disease requiring hemodialysis were excluded; additional exclusion criteria are listed in eTable 1 in the Supplement. Two investigators (M.K., M.K.) not involved in any of the selected trials independently abstracted the data using prespecified forms, appraised the accuracy of the abstractions, and resolved any discrepancies by consensus after discussion with a third investigator (E.P.N.). Two unblinded investigators (M.K., M.K.) independently appraised the potential risks of bias of the randomized clinical trials using the Cochrane Risk of Bias Tool.16 Any divergences in the bias assessment were then reported and summarized as Cohen κ coefficients (eTable 2 in the Supplement).
More intensive therapy was defined as the more potent pharmacologic strategy, while less intensive therapy corresponded to the control group of the original trial. Mean or median baseline and final LDL-C values were abstracted for both treatment groups.
Outcomes
The coprimary end points were total mortality and cardiovascular mortality. Secondary end points included myocardial infarction, cerebrovascular events, revascularizations (coronary artery bypass graft surgery, coronary or other arterial percutaneous interventions), and major cardiovascular events (MACE) (eTables 3 and 4 in the Supplement). Event rates reported in the trial manuscript were abstracted if available; if not reported, then event rates from the 2010 Cholesterol Treatment Trialists’ Collaboration (CTT) meta-analysis of statin trials were used.1
Statistical Analyses
Trial-level data were analyzed according to the original randomization group for which outcome data were available. To account for potential differences in study duration and drug exposure, rate ratios (RRs) with 95% confidence intervals derived from an analysis with adjusted models by person-years, a measure incorporating trial duration, were used as summary statistics. Absolute risk differences (ARDs) were expressed as incident events per 1000 person-years.
Random-effects meta-regression with baseline LDL-C level as a covariate was used for the main model, with additional covariates added in the adjusted analyses. Statistical heterogeneity was assessed using the Cochran Q test and the I2 statistic.18 In the meta-analyses, pooled RRs were calculated using a random-effects model. Stratified analyses were prespecified. Potential publication bias was estimated both visually and by a linear regression approach.19 Meta-regression was used to investigate the associations of baseline LDL-C levels on the trial RRs for all end points.20
Sensitivity analyses were performed to evaluate the robustness of the association between baseline LDL-C level and each outcome after adjustment for magnitude of LDL-C reduction, type of drug, trial population, age, and date of publication (Supplement).
For the summary treatment association estimate, P < .05 (2-tailed) was considered statistically significant. To compare treatment associations in subgroups, a χ2 test of interaction was performed; the Bonferroni correction was applied for multiple comparisons.
Analyses were conducted using Review Manager version 5.3 (Cochrane Collaboration) and Comprehensive Meta-Analysis Software 2.0 (Biostat).
Results
Study Selection and Patient Population
The PRISMA flow diagram of the meta-analysis is shown in Figure 1. Of the 11 756 studies initially identified, 11 625 were excluded based on title/abstract content; 99 studies did not meet explicit inclusion criteria. Two additional trials were identified by reviewing previous systematic reviews and meta-analyses. Table 1 describes the characteristics of each included trial. Each event analysis included 34 trials2,3,4,5,7,8,9,10,11,12,21,22,23,24,25,26,27,28,29,30,31,32,33,34,35,36,37,38,39,40,41,42,43 (N = 270 288) except the MACE analysis, which included 32 trials (N = 258 333). In 26 trials, the patients received statin monotherapy7,8,9,10,11,12,21,22,23,24,25,26,27,28,29,30,31,32,33,34,35,36,37,38,39,40; in 3 trials,2,41,42 statin and ezetimibe; and in 5 trials,3,4,5,43 statin and PCSK9-inhibiting monoclonal antibodies. Eight trials9,24,32,35,37,40,41,42 were conducted in primary prevention, 162,3,7,8,10,11,12,22,23,25,27,29,33,34,38,39 in secondary prevention, and 104,5,21,26,28,30,31,36,43 in both primary and secondary prevention. The longest mean follow-up was 6.7 years,39 and the mean weighted follow-up was 3.9 years. Baseline LDL-C levels ranged from 92 mg/dL to 192 mg/dL (weighted mean, 122 mg/dL). (To convert LDL-C values to mmol/L, multiply by 0.0259.)
Figure 1. Search and Selection Process of Randomized Clinical Trials Evaluating the Effect of Low-Density Lipoprotein Cholesterol–Lowering Therapies on Cardiovascular Outcomes.

LDL-C indicates low-density lipoprotein cholesterol.
aComparison of different groups of drugs in monotherapy.
Table 1. Study and Patient Baseline Characteristicsa.
| Source | No. | No. (%) | Median Follow-up, y | More Intensive LDL-C Lowering | Less Intensive LDL-C Lowering | |||||||
|---|---|---|---|---|---|---|---|---|---|---|---|---|
| Women | History | Treatment | Baseline LDL-C, Mean (SD), mg/dL | LDL-C Reduction, % | Treatment | Baseline LDL-C, Mean (SD), mg/dL | LDL-C Reduction, % | |||||
| Diabetes | Vascular Disease | CAD | ||||||||||
| 4S,7 1994 | 4444 | 827 (19) | 202 (5) | 4444 (100) | 4444 (100) | 5.4 (IQR, 4.9-6.3) | Simvastatin (20-40 mg) [n = 2221] | 188.32 (25.52) | −35 | Placebo [n = 2223] | 188.32 (25.14) | 1 |
| WOSCOPS,21 1995 | 6595 | 0 | 76 (1) | 531 (8) | 338 (5) | 4.9 | Pravastatin (40 mg) [n = 3302] | 192 (17) | −26 | Placebo [n = 3293] | 192 (17) | NA |
| CARE,22 1996 | 4159 | 576 (14) | 586 (14) | 4159 (100) | 4159 (100) | 5.0 (IQR, 4.0-6.2) | Pravastatin (40 mg) [n = 2081] | 139 (15) | −32 | Placebo [n = 2078] | 139 (15) | −3 |
| THE POST CABG Trial,23 1997 | 1351 | 105 (8) | 118 (9) | 1351 (100) | 1351 (100) | 4.3 | Lovastatin (40-80 mg) [n = 676]a | 155.35 (1.11) | −40 | Lovastatin (2.5-5 mg) [n = 675]b | 155.60 (1.09) | −13 |
| AFCAPS-TexCAPS,24 1998 | 6605 | 997 (15) | 155 (2) | <1 | <1 | 5.2 (range, 0.2-7.2) | Lovastatin (20-40 mg) [n = 3304] | 150 (17) | −23 | Placebo [n = 3301] | 150 (17) | 4 |
| LIPID,8 1998 | 9014 | 1516 (17) | 782 (9) | 9014 (100) | 9014 (100) | 6.1 | Pravastatin (40 mg) [n = 4512] | 150 | >25 | Placebo [n = 4502] | 150 | NA |
| GISSI-P,25 2000 | 4271 | 587 (14) | 582 (14) | 4271 (100) | 4271 (100) | 2 | Pravastatin (20 mg) [n = 2138] | 151.8 (25.8) | −15 | Usual care [n = 2133] | 151.5 (26.0) | −3 |
| ALLHAT–LLT,26 2002 | 10 355 | 5051 (49) | 3638 (35) | NR | 1475 (14) | 4.8 | Pravastatin (40 mg) [n = 5170] | 145.6 (21.4) | −29 | Usual care [n = 5185] | 145.5 (21.3) | −17 |
| GREACE,27 2002 | 1600 | 344 (22) | 313 (20) | 1600 (100) | 1600 (100) | 3 | Atorvastatin (10-80 mg) [n = 800] | 180 (27) | −46 | Usual care [n = 800] | 179 (28) | −5 |
| HPS,28 2002 | 20 536 | 5082 (25) | 5963 (29) | 17 907 (87) | 13 3386 (65) | 5 | Simvastatin (40 mg) [n = 10 269] | 131.47 (30.93) | −29 | Placebo [n = 10 267] | 131.47 (30.931) | −9 |
| LIPS,29 2002 | 1677 | 271 (16) | 202 (12) | 1677 (100) | 1677 (100) | 3.9 | Fluvastatin (80 mg) [n = 844] | 131 (29.0) | −27 | Placebo [n = 833] | 132 (30.5) | 11 |
| PROSPER,30 2002 | 5804 | 3000 (52) | 623 (11) | 2565 (44) | 2335 (40) | 3.2 (range, 2.8-4.0) | Pravastatin (40 mg) [n = 2891] | 146.95 (30.94) | −34 | Placebo [n = 2913] | 146.95 (30.94) | 0 |
| ALERT,31 2003 | 2102 | 715 (34) | 396 (19) | 158 (8) | 148 (7) | 5.4 (IQR, 5.2-5.6) | Fluvastatin (40 mg) [n = 1050] | 158.54 (38.67) | −32 | Placebo [n = 1052] | 158.54 (38.67) | −8 |
| ASCOT-LLA,32 2003 | 10 305 | 1942 (19) | 2527 (25) | 1515 (15) | <1 | 3.3 | Atorvastatin (10 mg) [n = 5168] | 133.02 (27.84) | −33 | Placebo [n = 5137] | 133.02 (27.84) | −5 |
| A to Z,33 2004 | 4497 | 1100 (24) | 1059 (24) | 4497 (100) | 4497 (100) | 2 | Simvastatin (80 mg) [n = 2265]c | 112 | −41 | Simvastatin (20 mg) [n = 2232]c | 111 | −27 |
| ALLIANCE,34 2004 | 2442 | 434 (18) | 540 (22) | 2442 (100) | 2442 (100) | 4.5 | Atorvastatin (10-80 mg) [n = 1217] | 147 | −34 | Usual care [n = 1225] | 146 | −23 |
| CARDS,35 2004 | 2841 | 909 (32) | 2838 (100) | <1 | <1 | 3.9 (IQR, 3.0-4.7) | Atorvastatin (10 mg) [n = 1429] | 117.56 (27.84) | −31 | Placebo [n = 1412] | 116.78 (27.07) | 3 |
| PROVE IT-TIMI,12 22 2004 | 4162 | 911 (22) | 734 (18) | 4162 (100) | 4162 (100) | 2 | Atorvastatin (80 mg) [n = 2099] | 106 | −42 | Pravastatin (40 mg) [n = 2063] | 106 | −10 |
| TNT,10 2005 | 10 001 | 1902 (19) | 1501 (15) | 10 001 (100) | 10 001 (100) | 4.9 | Atorvastatin (80 mg) [n = 4995] | 97 (18) | −21 | Atorvastatin (10 mg) [n = 5006] | 98 (18) | 3 |
| IDEAL,11 2005 | 8888 | 1702 (19) | 1069 (12) | 8888 (100) | 8888 (100) | 4.8 (range, 4.0-5.9) | Atorvastatin (80 mg) [n = 4439] | 121.6 (0.5) | −34 | Simvastatin (20 mg) [n = 4449] | 121.4 (0.5) | −18 |
| ASPEN,36 2006 | 2410 | 811 (34) | 2410 (100) | 1121 (47) | 790 (33) | 4 | Atorvastatin (10 mg) [n = 1211] | 113 (25) | −30 | Placebo [n = 1199] | 114 (26) | −1 |
| MEGA,37 2006 | 8214 | 5547 (68) | 1686 (21) | <1 | <1 | 5.3 | Pravastatin (10-20 mg) [n = 3866] | 156.61 (17.79) | −22 | Usual care [n = 3966] | 156.61 (17.40) | −9 |
| SPARCL,38 2006 | 4731 | 1908 (40) | 794 (17) | 4731 (100) | 0 | 4.9 (range, 4.0-6.6) | Atorvastatin (80 mg) [n = 2365] | 132.7 (0.5) | −45 | Placebo [n = 2366] | 133.7 (0.5) | −4 |
| JUPITER,9 2008 | 17 802 | 6801 (30) | 76 (<1) | 0 | 0 | 1.9 | Rosuvastatin (20 mg) [n = 8901] | 108 | −49 | Placebo [n = 8901] | 108 | 1 |
| SEARCH,39 2010 | 12 064 | 2052 (17) | 1267 (11) | 12 064 (100) | 12 064 (100) | 6.7 | Simvastatin (80 mg) [n = 6031] | 96.67 | >13 | Simvastatin (20 mg) [n = 6033] | 96.67 | NA |
| HOPE-3,40 2016 | 12 705 | 5874 (46) | 731 (6) | 0 | 0 | 5.6 | Rosuvastatin (10 mg) [n = 6361] | 127.8 (36.1) | −26 | Placebo [n = 6344] | 127.9 (36.0) | −4 |
| SEAS,41 2008 | 1873 | 723 (39) | 0% | 0 | 0 | 4.4 | Simvastatin (40 mg) + ezetimibe (10 mg) [n = 944] | 140 (36) | −54 | Placebo [n = 929] | 139 (35) | −4 |
| SHARP,42 2011 | 9270 | 3470 (37) | 2094 (23) | 1393 (15) | 0 | 4.9 | Simvastatin (20 mg) + ezetimibe (10 mg) [n = 4650]b | 107.12 (34.03) | −30 | Placebo [n = 4620] | 107.50 (33.64) | −3 |
| IMPROVE-IT,2 2015 | 18 144 | 4416 (24) | 4933 (27) | 18 144 (100) | 18 144 (100) | 6 | Simvastatin (40 mg) + ezetimibe (10 mg) [n = 9067] | 93.8 | −43 | Simvastatin (40 mg) [n = 9077] | 93.8 | −26 |
| ODYSSEY LONG TERM,4 2015 | 2341 | 884 (38) | 809 (35) | 2341 (100)d | 1607 (69) | 1.5 | Alirocumab (150 mg every 2 wk) [n = 1553] | 122.7 (42.6) | −53 | Placebo [n = 788] | 121.9 (41.4) | 1 |
| OSLER 1 & 2,5 2015 | 4465 | 2210 (49) | 599 (13) | 1303 (29) | 896 (20) | 0.9 | Evolocumab (140 mg every 2 wk or 420 mg every mo) [n = 2976] | 120 | −61 | Usual care [n = 1489] | 121 | NA |
| FOURIER,3 2017 | 27 564 | 6769 (25) | 10 081 (37) | 27 564 (100) | 22 351 (81) | 2.2 (IQR, 1.8-2.5) | Evolocumab (140 mg every 2 wk or 420 mg every mo) [n = 13 784] | 92 | −61 | Placebo [n = 13 780] | 92 | 0 |
| SPIRE-1,43 2017 | 16 817 | 4439 (26) | 8047 (48) | 14 563 (87) | NA | 0.6 | Bococizumab (150 mg every 2 wk) [n = 8408] | 93.8 | −45 | Placebo [n = 8409] | 93.7 | 7 |
| SPIRE-2,43 2017 | 10 621 | 3675 (35) | 4986 (47) | 8635 (81) | NA | 1 | Bococizumab (150 mg every 2 wk) [n = 5312] | 133.9 | −41 | Placebo [n = 5309] | 133.4 | 3 |
| All trials | 270 288e | 3.9 | ||||||||||
Abbreviations: CAD, coronary artery disease; IQR, interquartile range; LDL-C, low-density lipoprotein cholesterol; NA, not available.
SI conversion factor: To convert LDL-C values to mmol/L, multiply by 0.02586.
For expansions of study names, see eTable 3 in the Supplement.
Cholestyramine (8 g/d) was added to the regimen if LDL-C level at 2 consecutive visits remained above 95 mg/dL in the more intensive treatment group or at or above 160 mg/dL in the less intensive group. Patients given cholestyramine continued to receive lovastatin (80 mg/d in the more intensive group and 5 mg/d in the less intensive group).
Patients received 40 mg/d of simvastatin for 1 month followed by 80 mg/d in the more intensive treatment group, vs patients receiving placebo for 4 months followed by 20 mg/d of simvastatin in the less intensive group.
Heterozygous familial hypercholesterolemia or a coronary heart disease risk equivalent defined as peripheral arterial disease, ischemic stroke, moderate chronic kidney disease (estimated glomerular filtration rate, 30 to <60 mL/min/1.73 m2 of body surface area), or diabetes mellitus plus 2 or more additional risk factors (hypertension; ankle–brachial index ≤0.90; microalbuminuria, macroalbuminuria, or a urinary dipstick result of >2+ protein; preproliferative or proliferative retinopathy or laser treatment for retinopathy; or a family history of premature coronary heart disease).
Total number of patients is not exact sum of the above values, as the analysis was performed according to intention-to-treat principle; the difference is driven by MEGA study, in which 382 patients were assigned and randomized to lipid-lowering regimens, but these data are missing in the final analysis.
Risk of Bias
Potential sources of bias are shown in eTable 2 in the Supplement. Publication bias ranging from none to moderate was suggested by visual inspection of the funnel plots or by the linear regression approach (eFigure 1 in the Supplement). The included trials were not significantly different with regard to risk of bias. All were multicenter and conducted according to the intention-to-treat principle. Blinding was applied to participants and personnel (28/34 trials), outcome assessment (32/34 trials), or both.
All-Cause Mortality
Overall, 9651 of 136 299 patients (7.08%) receiving the more intensive LDL-C–lowering strategy vs 10 311 of 133 989 (7.70%) receiving the less intensive strategy died during follow-up. In a meta-regression, for each 40-mg/dL higher baseline LDL-C level, more vs less intensive LDL-C lowering was associated with a change in RRs for all-cause mortality of 0.91 (95% CI, 0.86 to 0.96; P = .001; ARD, −1.05 incident cases per 1000 person-years [95% CI, −1.59 to −0.51]) (Figure 2), which remained unchanged after multivariable adjustment (Table 2). The risk reduction in all-cause mortality associated with more vs less intensive therapy across all trials was 0.92 (95% CI, 0.88 to 0.96) but varied by the baseline LDL-C level in the trial (Figure 3). In a meta-analysis by subgroups of baseline LDL-C level, all-cause mortality risk was associated with a reduction only in the trials with baseline LDL-C levels of 100 mg/dL or greater (P < .001 for interaction) (Figure 3). The subgroup with baseline LDL-C levels of 160 mg/dL or greater yielded the highest reductions (RR, 0.72 [95% CI, 0.62 to 0.84]; P < .001; ARD, −4.37 incident cases per 1000 person-years [95% CI, −8.0 to −0.74]). Statistical heterogeneity was present in the trials with baseline LDL-C levels of 100 to 129 mg/dL, which appeared attributable to differences in the types of lipid-lowering agents used: statins (7 trials; RR, 0.88 [95% CI, 0.80 to 0.96]) vs PCSK9-inhibiting monoclonal antibodies (2 trials [ODYSSEY LONG TERM4 and OSLER5]; RR, 0.38 [95% CI, 0.18 to 0.80]) vs statin + ezetimibe (1 trial; RR, 1.02 [95% CI, 0.94 to 1.11]), P = .02 for interaction (eTable 5 in the Supplement).
Figure 2. Meta-regression Analysis of All-cause Mortality by Baseline LDL-C Level (34 RCTs).

Change in rate ratios (RRs) and 95% confidence intervals of more intensive vs less intensive low-density lipoprotein cholesterol (LDL-C)–lowering therapies plotted against baseline LDL-C level in the more intensive treatment group. Numbers indicate reference numbers of randomized clinical trials (RCTs). Size of the data markers is proportional to the weight in the meta-regression. Data marker colors represent the classes of lipid-lowering agents used in the active treatment group as per trial randomization design. Baseline levels are from the more intensive treatment group. The solid line represents the meta-regression slope of the change in rate ratio for treatment across increasing levels of baseline LDL-C. Results do not change when using baseline LDL-C values from the less intensive treatment group. To convert LDL-C values to mmol/L, multiply by 0.0259.
Table 2. Multivariable Meta-regression Models for the Association of Each 40-mg/dL (1-mmol/L) Higher Baseline LDL-C Level and Mortality and Other Cardiovascular Outcomes.
| Outcome | No. | RR (95%CI) | ||||
|---|---|---|---|---|---|---|
| Baseline LDL-C | Magnitude of LDL-C Reduction | Multivariable Models | ||||
| Studies | Patients | Baseline LDL-C Adjusted for Magnitude of LDL-C Reduction | Baseline LDL-C Adjusted for Magnitude of LDL-C Reduction, Baseline Risk Profile, Type of Agent, and Agea | |||
| All-cause mortality | 34 | 270 288 | 0.91 (0.86-0.96) | 0.96 (0.88-1.01) | 0.90 (0.84-0.96) | 0.91 (0.85-0.98) |
| Cardiovascular mortality | 34 | 270 288 | 0.86 (0.80-0.94) | 0.89 (0.73-1.01) | 0.89 (0.81-0.95) | 0.88 (0.80-0.97) |
| Myocardial infarction | 34 | 270 288 | 0.90 (0.84-0.97) | 0.85 (0.78-0.96) | 0.90 (0.83-0.97) | 0.91 (0.85-0.98) |
| Cerebrovascular events | 34 | 270 288 | 1.02 (0.93-1.11) | 0.99 (0.86-1.08) | 1.04 (0.93-1.16) | 1.07 (0.91-1.25) |
| Revascularization | 34 | 270 288 | 0.91 (0.85-0.99) | 0.89 (0.82-0.96) | 0.92 (0.86-0.98) | 0.90 (0.82-0.99) |
| Major cardiovascular events | 32 | 258 333 | 0.90 (0.87-0.97) | 0.96 (0.79-0.89) | 0.89 (0.83-0.96) | 0.91 (0.85-0.98) |
Abbreviations: LDL-C, low-density lipoprotein cholesterol; RR, rate ratio.
Type of agent refers to use of statins, ezetimibe, or proprotein convertase subtilisin/kexin type 9 inhibitors in the active group and baseline risk profile to primary vs secondary prevention setting.
Figure 3. Meta-analysis of All-cause Mortality Stratified by Baseline LDL-C Level.
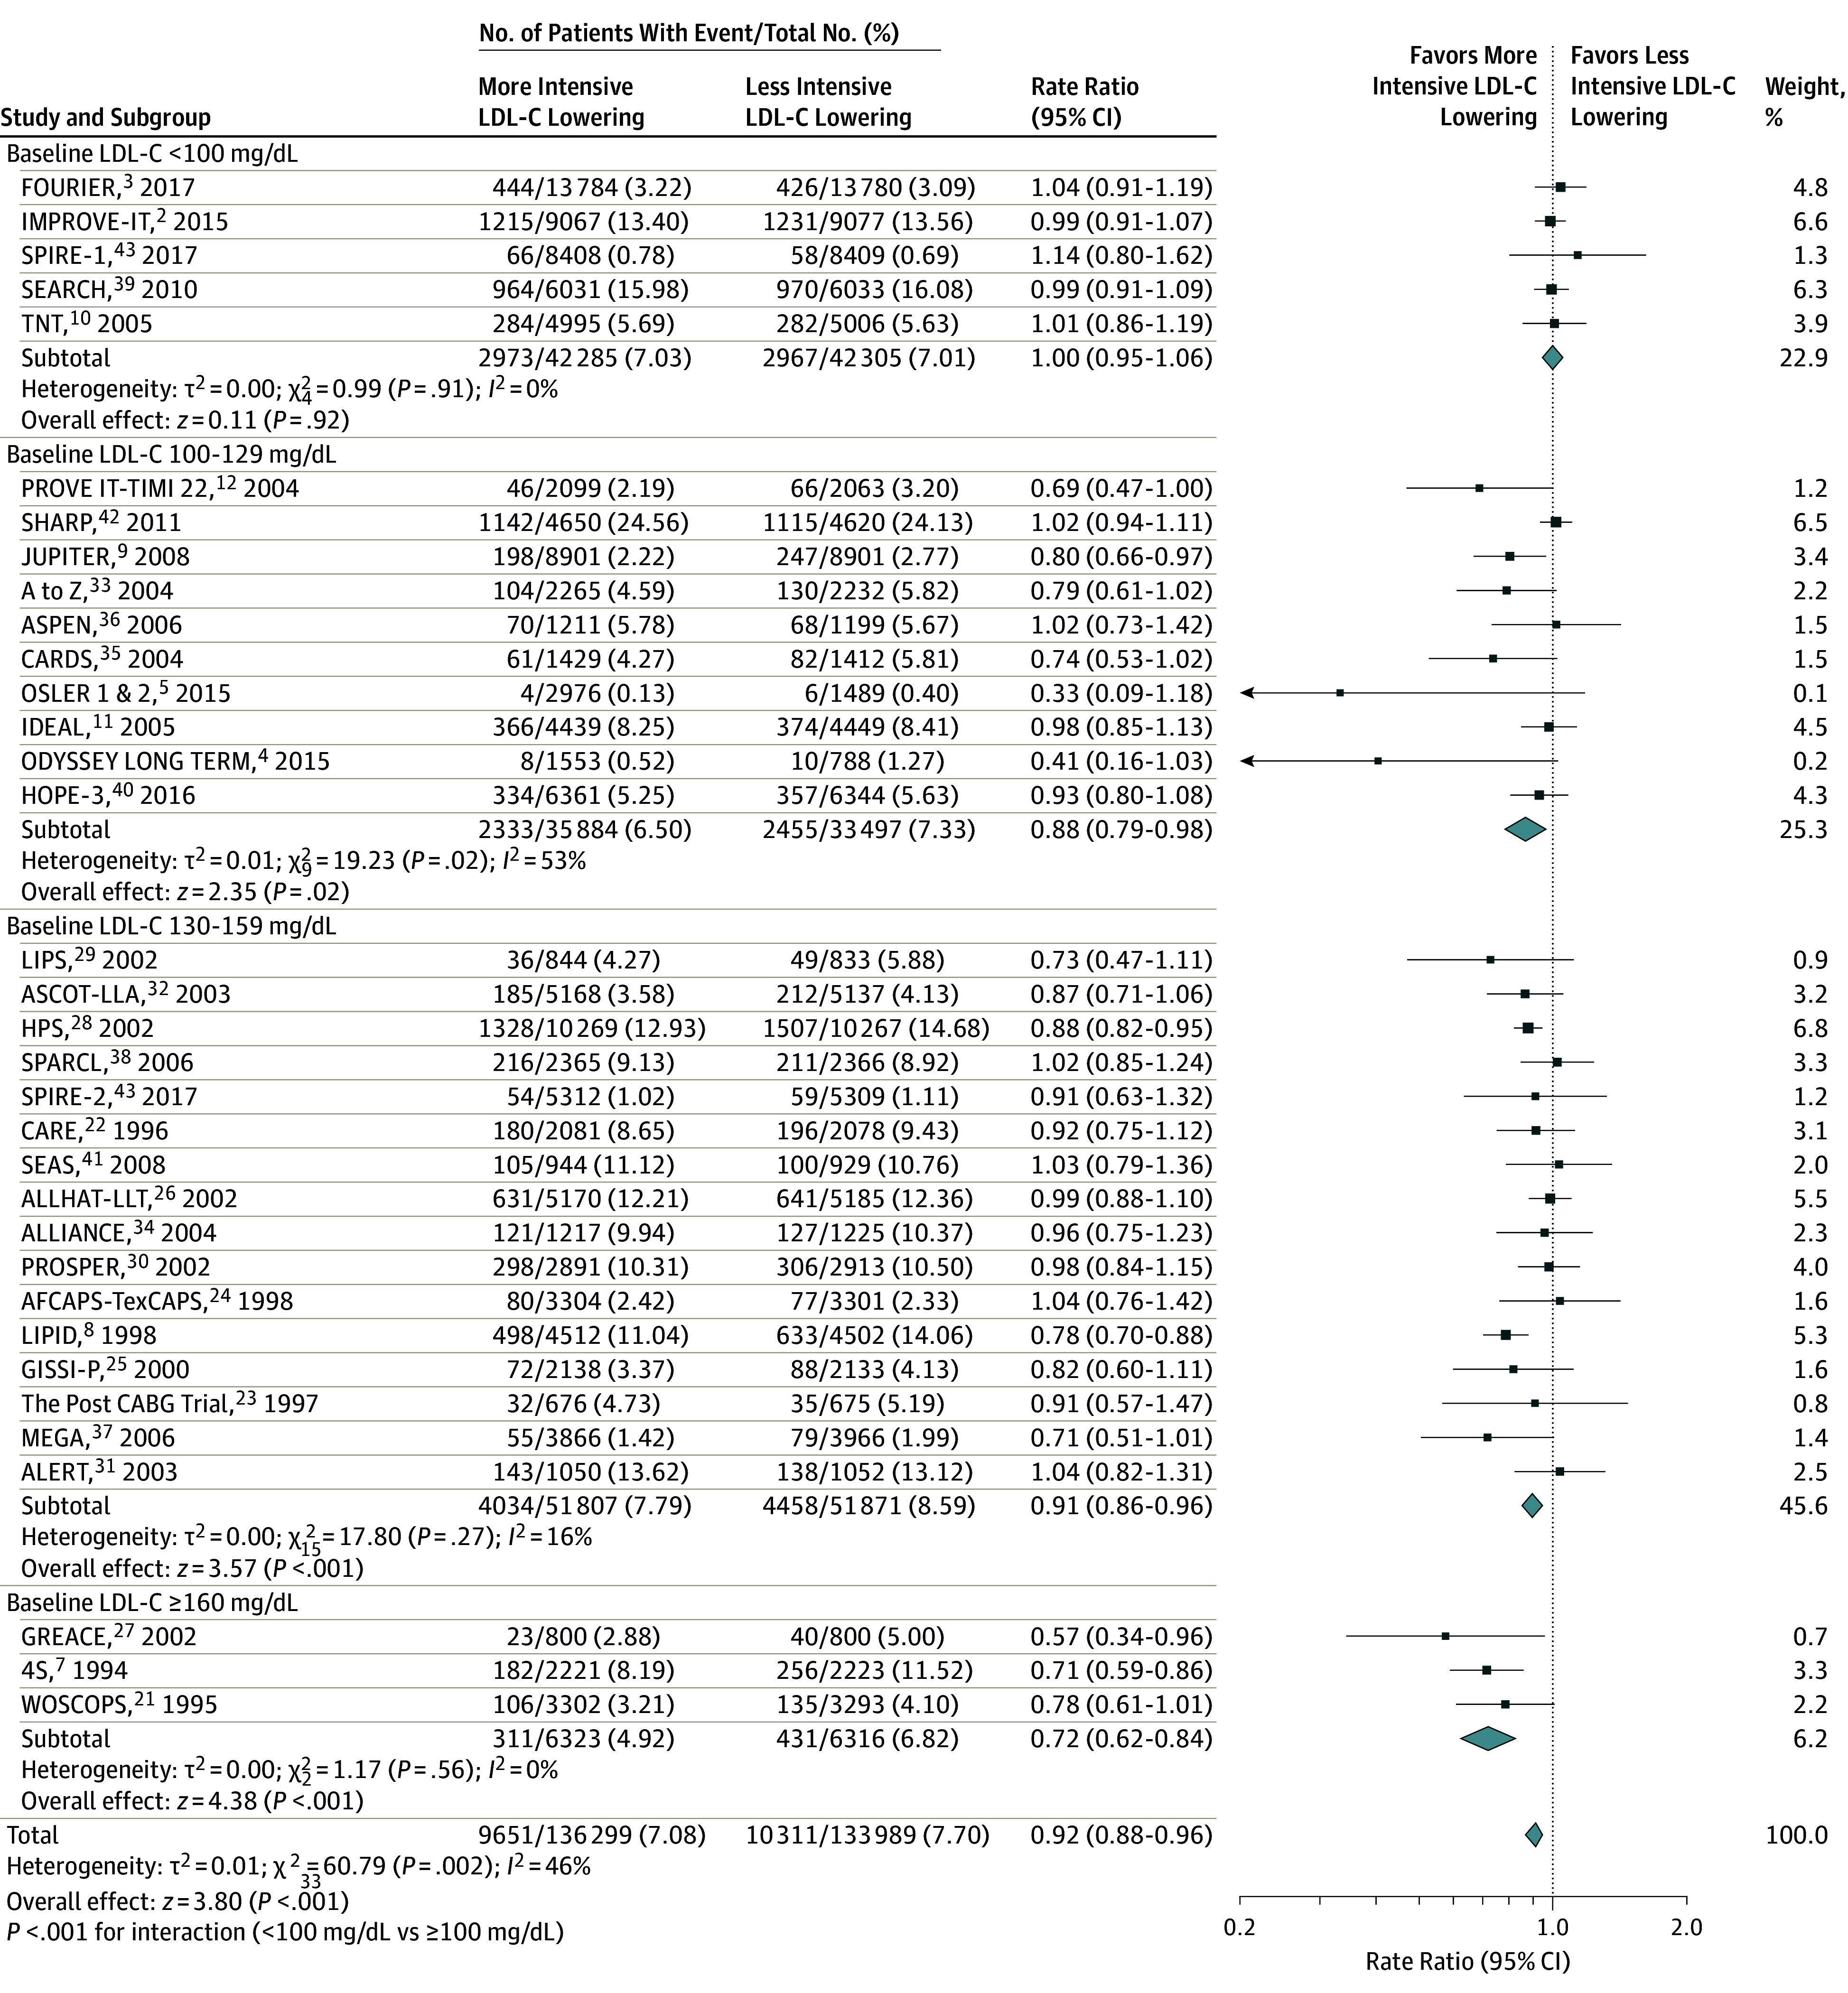
Rate ratios (RRs) and 95% confidence intervals of more intensive vs less intensive low-density lipoprotein cholesterol (LDL-C)–lowering therapies. Size of study data markers is proportional to the weight in the meta-analysis. To convert LDL-C values to mmol/L, multiply by 0.0259.
Cardiovascular Mortality
Overall, 4690 of 136 299 patients (3.44%) receiving the more intensive LDL-C–lowering strategy vs 5343 of 133 989 (3.99%) receiving the less intensive strategy died of cardiovascular causes during follow-up. In a meta-regression, for each 40-mg/dL higher baseline LDL-C level, more vs less intensive LDL-C lowering was associated with a change in RRs for cardiovascular mortality of 0.85 (95% CI, 0.80 to 0.91; P < .001; ARD, −1.0 incident cases per 1000 person-years [95% CI, −1.51 to −0.45]) (Figure 4), which remained unchanged after multivariable adjustment (Table 2). The overall risk reduction in cardiovascular mortality associated with more vs less intensive therapy across all trials was 0.86 (95% CI, 0.81 to 0.91) but varied by baseline LDL-C of those in the trial (Figure 5). In a meta-analysis by subgroups of baseline LDL-C level, cardiovascular mortality was associated with a reduction in risk only in the trials with baseline LDL-C levels of 100 mg/dL or greater (P < .001 for interaction) (Figure 5). The subgroup with baseline LDL-C levels of 160 mg/dL or greater yielded the highest reductions (RR, 0.65 [95% CI, 0.54 to 0.77]; P < .001; ARD, −4.3 incident cases per 1000 person-years [95% CI, −8.30 to −0.38]; P < .001 for interaction). Statistical heterogeneity was present in the subgroup of trials with baseline LDL-C levels of 100 to 129 mg/dL, which did not appear to be attributable to agents used, trial population, level of risk, or age (eTable 5 in the Supplement).
Figure 4. Meta-regression Analysis of Cardiovascular Mortality by Baseline LDL-C Level (34 RCTs).

Change in rate ratios (RRs) and 95% confidence intervals of more intensive vs less intensive low-density lipoprotein cholesterol (LDL-C)–lowering therapies plotted against baseline LDL-C level in the more intensive treatment group. Numbers indicate reference numbers of randomized clinical trials (RCTs). Size of the data markers is proportional to the weight in the meta-regression. Data marker colors represent the classes of lipid-lowering agents used in the active treatment group as per trial randomization design. Baseline levels are from the more intensive treatment group. The solid line represents the meta-regression slope of the change in rate ratio for treatment across increasing levels of baseline LDL-C. Results do not change when using baseline LDL-C values from the less intensive treament group. To convert LDL-C values to mmol/L, multiply by 0.0259.
Figure 5. Meta-analysis of Cardiovascular Mortality Stratified by Baseline LDL-C Level.
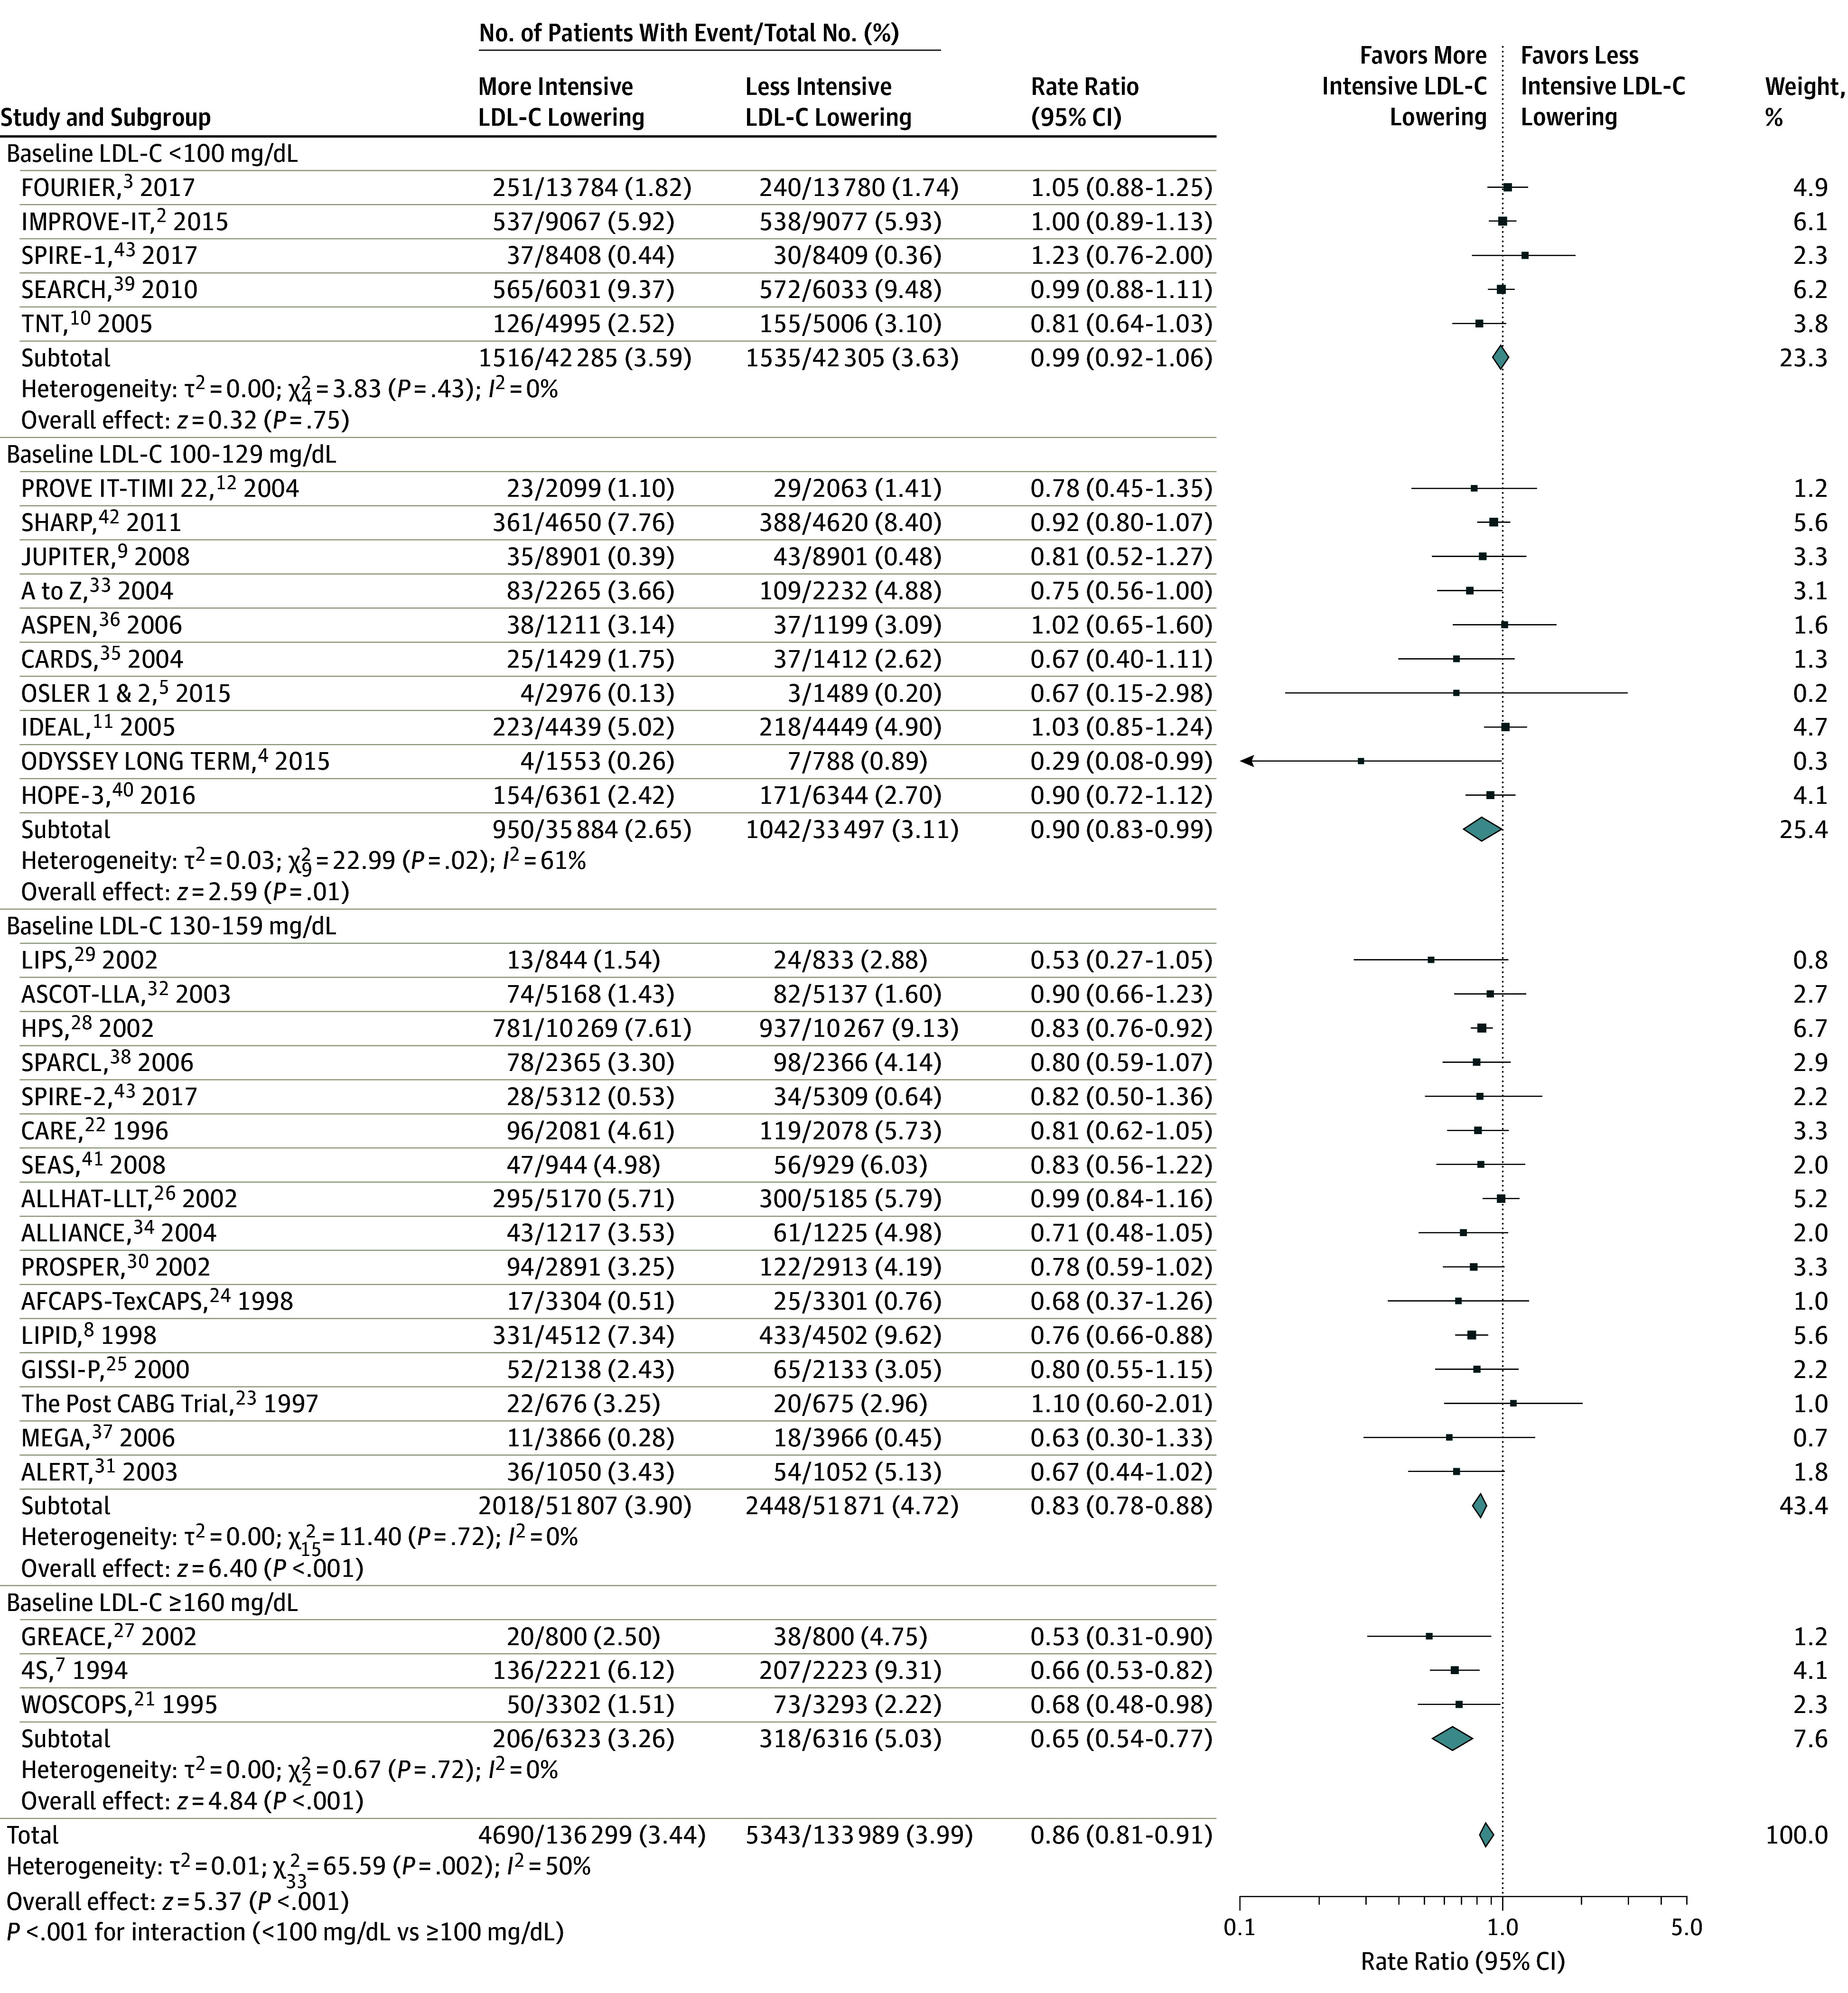
Rate ratios (RRs) and 95% confidence intervals of more intensive vs less intensive low-density lipoprotein cholesterol (LDL-C)–lowering therapies. Size of study data markers is proportional to the weight in the meta-analysis. To convert the values for LDL cholesterol to mmol/L, multiply by 0.0259.
In the more intensive groups, cardiovascular deaths comprised 51.0% of total deaths when baseline LDL-C level was less than 100 mg/dL, 42.8% when 100 to 129 mg/dL, 50.0% when 130 to 159 mg/dL, and 66.2% when 160 mg/dL or greater.
Myocardial Infarction
Overall, 6343 of 136 299 patients (4.65%) receiving the more intensive LDL-C–lowering strategy vs 8098 of 133 989 (6.04%) receiving the less intensive strategy experienced a myocardial infarction during follow-up. In a meta-regression, for each 40-mg/dL higher baseline LDL-C level, more vs less intensive LDL-C lowering was associated with a change in RRs for myocardial infarction of 0.90 (95% CI, 0.84 to 0.97; P = .007; ARD, −1.23 incident cases per 1000 person-years [95% CI, −2.24 to −0.21]) (Figure 6), which remained unchanged after multivariable adjustment (Table 2). The overall risk reduction in myocardial infarction with more vs less intensive LDL-C therapy across all trials was 0.76 (95% CI, 0.72 to 0.80) (eFigure 2 in the Supplement) but varied by the baseline LDL-C levels of those in the trial. In a meta-analysis by subgroups of baseline LDL-C, risk of myocardial infarction was associated with a risk reduction in all subgroups of baseline LDL-C level, ranging from baseline levels less than 100 mg/dL (RR, 0.84 [95% CI, 0.76-0.92]; P < .001; ARD, −2.89 incident cases per 1000 person-years [95% CI, −4.40 to −1.38]) to baseline levels of 160 mg/dL or greater (RR, 0.64 [95% CI, 0.53 to 0.78]; P < .001; ARD, −8.82 incident cases per 1000 person-years [95% CI, −15.13 to −2.52]), with a nonsignificant P value for interaction in the subgroups with baseline LDL-C levels less than 100 mg/dL vs 100 mg/dL or greater (eFigure 2 in the Supplement). Statistical heterogeneity was present in the trials with baseline LDL-C levels less than 100 mg/dL and in those with baseline LDL-C levels of 100 to 129 mg/dL, which did not appear to be attributable to agents used, trial population, level of risk, or age (eTable 5 in the Supplement).
Figure 6. Meta-regression Analysis of (A) Myocardial Infarction; and (B) Cerebrovascular Events by Baseline LDL-C Level (34 RCTs).

Change in rate ratios (RRs) and 95% confidence intervals of more intensive vs less intensive low-density lipoprotein cholesterol (LDL-C)–lowering therapies plotted against baseline LDL-C level in the more intensive treatment group. Numbers indicate reference numbers of randomized clinical trials (RCTs). Size of the data markers is proportional to the weight in the meta-regression. Data marker colors represent the classes of lipid-lowering agents used in the active treatment group as per trial randomization design. Baseline levels are from the more intensive treatment group. The solid line represents the meta-regression slope of the change in rate ratio for treatment across increasing levels of baseline LDL-C. Results do not change when using baseline LDL-C values from the less intensive treatment group. To convert LDL-C values to mmol/L, multiply by 0.0259.
Cerebrovascular Events
Overall, 3271 of 136 299 patients (2.40%) receiving the more intensive LDL-C–lowering strategy vs 3970 of 133 989 (2.96%) receiving the less intensive strategy developed a cerebrovascular event during follow-up. In a meta-regression, cerebrovascular risk was not significantly different for each 40-mg/dL higher baseline LDL-C level and was associated with a change in RR of 1.02 (95% CI, 0.93 to 1.11; P = .61; ARD, −0.11 incident cases per 1000 person-years [95% CI, −1.02 to 0.76]) (Figure 6). Cerebrovascular events were associated with an RR of 0.82 (95% CI, 0.78 to 0.87; P < .001; ARD, −0.11 incident cases per 1000 person-years [95% CI, −1.02 to 0.76]) across the range of baseline LDL-C levels (eFigure 3 in the Supplement) and magnitudes of LDL-C lowering, which remained unchanged after multivariable adjustment (Table 2).
An analysis of 24 trials reporting ischemic stroke rates found that baseline LDL-C level was not significantly different for each 40-mg/dL higher LDL-C level (RR, 1.00 [95% CI, 0.90 to 1.12]; P = .96) (eFigure 4 in the Supplement) and was associated with an RR of 0.79 (95% CI, 0.74 to 0.84) across levels of baseline LDL-C less than 100 mg/dL and 100 mg/dL or greater (P = .72 for interaction) (eFigure 5 in the Supplement).
Revascularization Procedures
Overall, 9012 of 136 299 patients (6.61%) receiving the more intensive LDL-C–lowering strategy vs 10 991 of 133 989 (8.20%) receiving the less intensive strategy underwent revascularization. In a meta-regression, for each 40-mg/dL higher baseline LDL-C level, more vs less intensive LDL-C lowering was associated with a change in RRs for revascularization risk of 0.91 (95% CI, 0.85 to 0.99; P < .001), which remained unchanged after multivariable adjustment (eFigure 6 in the Supplement). Additional results for revascularization analyses are presented in Table 2 and in eFigure 7 in the Supplement.
Major Cardiovascular Events
MACE rates were reported in 32 trials, which included 258 333 patients. Overall, 14 460 of 130 329 patients (11.09%) receiving the more intensive LDL-C–lowering strategy experienced a MACE vs 17 091/128 004 (13.35%) for the less intensive strategy. In a meta-regression analysis, for each 40-mg/dL higher baseline LDL-C level, more vs less intensive LDL-C lowering was associated with a change in RRs for MACE of 0.90 (95% CI, 0.87 to 0.97; P < .001; ARD, −0.69 incident cases per 1000 person-years [95% CI, −1.30 to −0.11]), which remained unchanged after multivariable adjustment (Table 2; eFigure 8 in the Supplement). The overall risk reduction in MACE with more vs less intensive therapy across all trials was 0.81 (95% CI, 0.78 to 0.85) (eFigure 9 in the Supplement) but varied by the baseline LDL-C levels of those in the trial. In a meta-analysis by subgroup of baseline LDL-C level, in trials with baseline LDL-C levels less than 100 mg/dL, MACE risk was associated with an RR of 0.90 (95% CI, 0.85 to 0.96; P = .002; ARD, −3.66 incident cases per 1000 person-years [95% CI, −5.72 to −0.81) (eFigure 9 in the Supplement); statistical heterogeneity was present but did not appear to be attributable to agents used, trial population, level of risk, or age (eTable 5 in the Supplement). There was a significant interaction P value (P < .001) in treatment associations across the subgroups with baseline LDL-C levels of 100 mg/dL or greater vs lower than 100 mg/dL (eFigure 9 in the Supplement). In the group of trials with baseline LDL-C levels of 100 to 129 mg/dL, MACE risk was associated with an RR of 0.78 (95% CI, 0.70 to 0.86; ARD, −5.51 incident cases per 1000 person-years [95% CI, −7.76 to −3.26]), with statistical heterogeneity that did not appear to be attributable to agents used, trial population, level of risk, or age (eTable 5 in the Supplement).
Additional Analyses
The associations with risk reduction for each individual clinical end point remained unchanged across different subgroups when CTT baseline LDL-C cutoffs1 were applied (eFigures 10-15 in the Supplement), nor did they change by year of trial publication (eTable 6 in the Supplement), type of treatment in the control group (eTable 7 in the Supplement), type of agent used in the active treatment group (eTable 8 in the Supplement), or type of population (eTable 9 in the Supplement).
Meta-analysis of all-cause mortality found no association with achieved LDL-C level (eFigure 16 in the Supplement). The between-trials variance was largely attributable to baseline LDL-C level for rates of all-cause mortality (61%), cardiovascular mortality (61%), and MACE (62%) (eTable 10 in the Supplement). Baseline LDL-C level accounted for a substantial proportion of the variance for rates of myocardial infarction (45%) and had a more modest role in revascularization (28%). As a further sensitivity analysis, the influence of each trial was addressed, testing whether deleting each in turn would change significantly the pooled results of the meta-analysis. Deleting each trial in turn did not result in significant deviations from the original overall estimate, suggesting that the overall association is robust (eTable 11 in the Supplement). A further analysis restricted to studies at lower risk of bias with the blinding procedure applied during randomization confirmed the overall results (eTable 12 in the Supplement).
The association between all-cause mortality and absolute magnitude of LDL-C lowering was further investigated. All-cause mortality risk was minimally associated with 35-mg/dL or less reductions in LDL-C level (eFigure 17 in the Supplement). All-cause mortality was associated with an RR of 0.90 (95% CI, 0.85 to 0.96) in the trials with an LDL-C reduction of 35 to 65 mg/dL and an RR of 0.70 (95% CI, 0.52 to 0.95) in the trials with an LDL-C reduction greater than 65 mg/dL (P = .11 for interaction); however, statistical heterogeneity was present, and the 95% confidence intervals were wide.
Cardiovascular mortality risk was minimally associated with a reduction in the subgroup of trials with an LDL-C reduction less than 35 mg/dL (RR, 0.94 [95% CI, 0.89 to 1.00]) (eFigure 18 in the Supplement). Cardiovascular mortality was associated with an RR of 0.80 (95% CI, 0.73 to 0.88) in trials with an LDL-C reduction of 35 to 65 mg/dL and an RR of 0.66 (95% CI, 0.56 to 0.79) in trials with an LDL-C reduction greater than 65 mg/dL (P = .06 for interaction). Statistical heterogeneity was present in trials with LDL-C reductions of 35 to 65 mg/dL, with suggested differences in risk reduction across types of lipid-lowering agents used: statin (13 trials; RR, 0.76 [95% CI, 0.70 to 0.83]) vs PCSK9-inhibiting monoclonal antibody (3 trials; RR, 1.04 [95% CI, 0.89 to 1.22]; P < .001 for interaction) (eTable 5 in the Supplement). Myocardial infarction, stroke, and revascularization procedures were associated with a reduction across the range of magnitudes of LDL-C lowering (eFigures 19-21 in the Supplement). MACE risk was associated with reductions across the range of magnitudes of LDL-C lowering (eFigure 22 in the Supplement).
Discussion
In these meta-analyses and meta-regressions, more intensive compared with less intensive LDL-C lowering was associated with greater reduction in the risk of all-cause and cardiovascular mortality in trials of patients with higher baseline LDL-C levels. These associations were not present when baseline LDL-C levels were less than 100 mg/dL.
Statins, ezetimibe, and PCSK9-inhibiting monoclonal antibodies lower LDL-C level by a percentage of the baseline, so the magnitude of LDL-C lowering is a function of both baseline LDL-C level and drug efficacy. Although LDL-C reduction of 35 mg/dL or greater was also associated with progressively greater reductions in all-cause and cardiovascular mortality, the magnitude of LDL-C lowering did not alter the association between baseline LDL-C level and reductions in risk of all-cause or cardiovascular mortality.
Higher baseline LDL-C level was also associated with progressively greater relative risk reductions in myocardial infarction, revascularization procedures, and MACE, but no lower baseline LDL-C limit to this benefit was observed. Reduction in these events occurred across the range of LDL-C lowering, with progressively larger reductions in events as the baseline LDL-C level and the magnitude of LDL-C lowering increased. In contrast, the reduction in cerebrovascular events did not appear to be influenced by baseline LDL-C level or by the magnitude of LDL-C lowering. A similar lack of association with baseline LDL-C level and magnitude of LDL-C lowering was found for ischemic stroke.
These findings may provide an explanation for the lack of cardiovascular or all-cause mortality reductions that has been noted in the Further Cardiovascular Outcomes Research With PCSK9 Inhibition in Subjects With Elevated Risk (FOURIER) trial, despite a significant LDL-C reduction, as well as in the Improved Reduction of Outcomes: Vytorin Efficacy International Trial (IMPROVE-IT) and in the high- vs moderate-intensity statin trials with lesser magnitudes of LDL-C lowering.2,3,10,11,12 However, additional LDL-C lowering in these trials still provided additional reduction in myocardial infarctions, cerebrovascular events, revascularizations, and MACE.
Two smaller trials of the efficacy and safety of the PCSK9-inhibiting monoclonal antibodies alirocumab (ODYSSEY LONG TERM4) and evolocumab (OSLER5) support the role of higher baseline LDL-C level, along with greater magnitude of LDL-C lowering, for predicting a mortality benefit from LDL-C–lowering therapy. The ODYSSEY LONG TERM and OSLER trials had baseline LDL-C levels of approximately 120 mg/dL and LDL-C reductions of approximately 70 mg/dL. When pooled together in a previous meta-analysis, an association with all-cause and cardiovascular mortality benefit was found.6 The SPIRE-2 trial, another trial of a PCSK9-inhibiting monoclonal antibody, bococizumab, with a higher baseline LDL-C level was terminated early at 1 year because of loss of LDL-C–lowering efficacy from neutralizing antibodies.43
The relatively short 2.2-year duration of the FOURIER trial has been implicated in the lack of a cardiovascular mortality benefit, and trial duration was accounted for in the rate ratios used in these analyses. The ongoing ODYSSEY OUTCOMES trial (NCT01663402) is planned to be of somewhat longer duration than the FOURIER trial.44,45 Patients in the ODYSSEY OUTCOMES trial are within 1 year of an acute coronary event and have baseline LDL-C levels of 87 mg/dL; 80% are receiving a high-intensity statin.
These findings suggest that the CTT meta-analysis of statin trials finding that each 39-mg/dL (1-mmol/L) reduction in LDL-C level was associated with a hazard ratio of 0.78 (95% CI, 0.76 to 0.80) in the reduction in MACE may not be generalizable to populations with baseline LDL-C levels higher or lower than the mean LDL-C of 120 mg/dL in the meta-analysis or to composite end points other than MACE.1
In addition, in this analysis, stroke was reduced by a similar magnitude across the range of LDL-C lowering. It could be hypothesized that a greater reduction in risk of ischemic stroke might be counterbalanced by an increase in hemorrhagic stroke with increasing magnitude of LDL-C lowering. Although consistent reductions in ischemic stroke risk of 21% were found in a sensitivity analysis, too few trials reported hemorrhagic stroke rates for a definite conclusion (Supplement).
If additional LDL-C–lowering therapies are considered in statin-treated patients, nonstatin LDL-C–lowering therapies shown to reduce cardiovascular disease events are recommended.13,15 This analysis further supports individualizing estimates of the potential for a cardiovascular risk reduction benefit from LDL-C–lowering therapy based on consideration of not only a patient’s absolute risk and current LDL-C level but also an individualized estimate of the risk reduction based on current LDL-C level and the outcomes desired.46
Limitations
This study has several limitations. First, the analysis included only trial-level data. Only main trial results were considered. Subgroup analyses might have provided additional information on sources of heterogeneity of treatment associations. Second, end-of-trial LDL-C levels were used, which may have underestimated the full association of the magnitude of LDL-C lowering during a trial. Third, there was evidence of heterogeneity in some of the subgroup meta-analyses for mortality, coronary events, and MACE, although this may reflect the prespecified groupings used. No characteristic appeared to affect the meta-regression sensitivity analyses, in which the associations remained robust to all adjustments.
Conclusions
In these meta-analyses and meta-regressions, more intensive compared with less intensive LDL-C lowering was associated with a greater reduction in risk of total and cardiovascular mortality in trials of patients with higher baseline LDL-C levels. This association was not present when baseline LDL-C level was less than 100 mg/dL, suggesting that the greatest benefit from LDL-C–lowering therapy may occur for patients with higher baseline LDL-C levels.
eTables 1-12
eFigures 1-22
eReferences
References
- 1.Baigent C, Blackwell L, Emberson J, et al. ; Cholesterol Treatment Trialists’ (CTT) Collaboration . Efficacy and safety of more intensive lowering of LDL cholesterol: a meta-analysis of data from 170,000 participants in 26 randomised trials. Lancet. 2010;376(9753):1670-1681. [DOI] [PMC free article] [PubMed] [Google Scholar]
- 2.Cannon CP, Blazing MA, Giugliano RP, et al. ; IMPROVE-IT Investigators . Ezetimibe added to statin therapy after acute coronary syndromes. N Engl J Med. 2015;372(25):2387-2397. [DOI] [PubMed] [Google Scholar]
- 3.Sabatine MS, Giugliano RP, Keech AC, et al. ; FOURIER Steering Committee and Investigators . Evolocumab and clinical outcomes in patients with cardiovascular disease. N Engl J Med. 2017;376(18):1713-1722. [DOI] [PubMed] [Google Scholar]
- 4.Robinson JG, Farnier M, Krempf M, et al. ; ODYSSEY LONG TERM Investigators . Efficacy and safety of alirocumab in reducing lipids and cardiovascular events. N Engl J Med. 2015;372(16):1489-1499. [DOI] [PubMed] [Google Scholar]
- 5.Sabatine MS, Giugliano RP, Wiviott SD, et al. ; Open-Label Study of Long-Term Evaluation Against LDL Cholesterol (OSLER) Investigators . Efficacy and safety of evolocumab in reducing lipids and cardiovascular events. N Engl J Med. 2015;372(16):1500-1509. [DOI] [PubMed] [Google Scholar]
- 6.Navarese EP, Kolodziejczak M, Schulze V, et al. Effects of proprotein convertase subtilisin/kexin type 9 antibodies in adults with hypercholesterolemia: a systematic review and meta-analysis. Ann Intern Med. 2015;163(1):40-51. [DOI] [PubMed] [Google Scholar]
- 7.Randomised trial of cholesterol lowering in 4444 patients with coronary heart disease: the Scandinavian Simvastatin Survival Study (4S). Lancet. 1994;344(8934):1383-1389. [PubMed] [Google Scholar]
- 8.Long-Term Intervention with Pravastatin in Ischaemic Disease (LIPID) Study Group . Prevention of cardiovascular events and death with pravastatin in patients with coronary heart disease and a broad range of initial cholesterol levels. N Engl J Med. 1998;339(19):1349-1357. [DOI] [PubMed] [Google Scholar]
- 9.Ridker PM, Danielson E, Fonseca FA, et al. ; JUPITER Study Group . Rosuvastatin to prevent vascular events in men and women with elevated C-reactive protein. N Engl J Med. 2008;359(21):2195-2207. [DOI] [PubMed] [Google Scholar]
- 10.LaRosa JC, Grundy SM, Waters DD, et al. ; Treating to New Targets (TNT) Investigators . Intensive lipid lowering with atorvastatin in patients with stable coronary disease. N Engl J Med. 2005;352(14):1425-1435. [DOI] [PubMed] [Google Scholar]
- 11.Pedersen TR, Faergeman O, Kastelein JJ, et al. ; Incremental Decrease in End Points Through Aggressive Lipid Lowering (IDEAL) Study Group . High-dose atorvastatin vs usual-dose simvastatin for secondary prevention after myocardial infarction: the IDEAL study: a randomized controlled trial. JAMA. 2005;294(19):2437-2445. [DOI] [PubMed] [Google Scholar]
- 12.Cannon CP, Braunwald E, McCabe CH, et al. ; Pravastatin or Atorvastatin Evaluation and Infection Therapy–Thrombolysis in Myocardial Infarction 22 Investigators . Intensive versus moderate lipid lowering with statins after acute coronary syndromes. N Engl J Med. 2004;350(15):1495-1504. [DOI] [PubMed] [Google Scholar]
- 13.Stone NJ, Robinson JG, Lichtenstein AH, et al. ; American College of Cardiology/American Heart Association Task Force on Practice Guidelines . 2013 ACC/AHA guideline on the treatment of blood cholesterol to reduce atherosclerotic cardiovascular risk in adults: a report of the American College of Cardiology/American Heart Association Task Force on Practice Guidelines. Circulation. 2014;129(25)(suppl 2):S1-S45. [DOI] [PubMed] [Google Scholar]
- 14.Tice JA; Institute for Clincal and Economic Review (ICER) . Evolocumab for treatment of high cholesterol: clinical effectiveness: new evidence update. Institute for Clincal and Economic Review website. https://icer-review.org/material/pcks9-inhibitors-neu/. June 13, 2017. Accessed March 16, 2018.
- 15.Landmesser U, Chapman MJ, Farnier M, et al. ; European Society of Cardiology (ESC); European Atherosclerosis Society (EAS) . European Society of Cardiology/European Atherosclerosis Society Task Force consensus statement on proprotein convertase subtilisin/kexin type 9 inhibitors: practical guidance for use in patients at very high cardiovascular risk. Eur Heart J. 2017;38(29):2245-2255. [DOI] [PubMed] [Google Scholar]
- 16.Higgins JPT, Green S. Cochrane Handbook for Systematic Reviews of Interventions Version 5.1.0 [updated March 2011]. The Cochrane Collaboration website. http://training.cochrane.org/handbook. 2011. Accessed February 26, 2018.
- 17.Moher D, Liberati A, Tetzlaff J, Altman DG; PRISMA Group . Preferred reporting items for systematic reviews and meta-analyses: the PRISMA statement. J Clin Epidemiol. 2009;62(10):1006-1012. [DOI] [PubMed] [Google Scholar]
- 18.Seeger P, Gabrielsson A. Applicability of the Cochran Q test and the F test for statistical analysis of dichotomous data for dependent samples. Psychol Bull. 1968;69(4):269-277. [DOI] [PubMed] [Google Scholar]
- 19.Harbord RM, Egger M, Sterne JA. A modified test for small-study effects in meta-analyses of controlled trials with binary endpoints. Stat Med. 2006;25(20):3443-3457. [DOI] [PubMed] [Google Scholar]
- 20.Stijnen T, Hamza TH, Ozdemir P. Random effects meta-analysis of event outcome in the framework of the generalized linear mixed model with applications in sparse data. Stat Med. 2010;29(29):3046-3067. [DOI] [PubMed] [Google Scholar]
- 21.Shepherd J, Cobbe SM, Ford I, et al. ; West of Scotland Coronary Prevention Study Group . Prevention of coronary heart disease with pravastatin in men with hypercholesterolemia. N Engl J Med. 1995;333(20):1301-1307. [DOI] [PubMed] [Google Scholar]
- 22.Sacks FM, Pfeffer MA, Moye LA, et al. ; Cholesterol and Recurrent Events Trial Investigators . The effect of pravastatin on coronary events after myocardial infarction in patients with average cholesterol levels. N Engl J Med. 1996;335(14):1001-1009. [DOI] [PubMed] [Google Scholar]
- 23.Post Coronary Artery Bypass Graft Trial Investigators . The effect of aggressive lowering of low-density lipoprotein cholesterol levels and low-dose anticoagulation on obstructive changes in saphenous-vein coronary-artery bypass grafts. N Engl J Med. 1997;336(3):153-162. [DOI] [PubMed] [Google Scholar]
- 24.Downs JR, Clearfield M, Weis S, et al. Primary prevention of acute coronary events with lovastatin in men and women with average cholesterol levels: results of AFCAPS/TexCAPS. JAMA. 1998;279(20):1615-1622. [DOI] [PubMed] [Google Scholar]
- 25.GISSI Prevenzione Investigators (Gruppo Italiano per lo Studio della Sopravvivenza nell’Infarto Miocardico) . Results of the low-dose (20 mg) pravastatin GISSI Prevenzione trial in 4271 patients with recent myocardial infarction: do stopped trials contribute to overall knowledge? Ital Heart J. 2000;1(12):810-820. [PubMed] [Google Scholar]
- 26.ALLHAT Officers and Coordinators for the ALLHAT Collaborative Research Group . Major outcomes in moderately hypercholesterolemic, hypertensive patients randomized to pravastatin vs usual care: the Antihypertensive and Lipid-Lowering Treatment to Prevent Heart Attack Trial (ALLHAT-LLT). JAMA. 2002;288(23):2998-3007. [DOI] [PubMed] [Google Scholar]
- 27.Athyros VG, Papageorgiou AA, Mercouris BR, et al. Treatment with atorvastatin to the National Cholesterol Educational Program goal versus ‘usual’ care in secondary coronary heart disease prevention: the GREek Atorvastatin and Coronary-heart-disease Evaluation (GREACE) study. Curr Med Res Opin. 2002;18(4):220-228. [DOI] [PubMed] [Google Scholar]
- 28.Heart Protection Study Collaborative Group . MRC/BHF Heart Protection Study of cholesterol lowering with simvastatin in 20,536 high-risk individuals: a randomised placebo-controlled trial. Lancet. 2002;360(9326):7-22. [DOI] [PubMed] [Google Scholar]
- 29.Serruys PW, de Feyter P, Macaya C, et al. ; Lescol Intervention Prevention Study (LIPS) Investigators . Fluvastatin for prevention of cardiac events following successful first percutaneous coronary intervention: a randomized controlled trial. JAMA. 2002;287(24):3215-3222. [DOI] [PubMed] [Google Scholar]
- 30.Shepherd J, Blauw GJ, Murphy MB, et al. ; PROSPER Study Group . Pravastatin in elderly individuals at risk of vascular disease (PROSPER): a randomised controlled trial. Lancet. 2002;360(9346):1623-1630. [DOI] [PubMed] [Google Scholar]
- 31.Holdaas H, Fellström B, Jardine AG, et al. ; Assessment of LEscol in Renal Transplantation (ALERT) Study Investigators . Effect of fluvastatin on cardiac outcomes in renal transplant recipients: a multicentre, randomised, placebo-controlled trial. Lancet. 2003;361(9374):2024-2031. [DOI] [PubMed] [Google Scholar]
- 32.Sever PS, Dahlöf B, Poulter NR, et al. ; ASCOT Investigators . Prevention of coronary and stroke events with atorvastatin in hypertensive patients who have average or lower-than-average cholesterol concentrations, in the Anglo-Scandinavian Cardiac Outcomes Trial—Lipid Lowering Arm (ASCOT-LLA): a multicentre randomised controlled trial. Lancet. 2003;361(9364):1149-1158. [DOI] [PubMed] [Google Scholar]
- 33.de Lemos JA, Blazing MA, Wiviott SD, et al. Early intensive vs a delayed conservative simvastatin strategy in patients with acute coronary syndromes: phase Z of the A to Z trial. JAMA. 2004;292(11):1307-1316. [DOI] [PubMed] [Google Scholar]
- 34.Koren MJ, Hunninghake DB; ALLIANCE Investigators . Clinical outcomes in managed-care patients with coronary heart disease treated aggressively in lipid-lowering disease management clinics: the alliance study. J Am Coll Cardiol. 2004;44(9):1772-1779. [DOI] [PubMed] [Google Scholar]
- 35.Colhoun HM, Betteridge DJ, Durrington PN, et al. ; CARDS Investigators . Primary prevention of cardiovascular disease with atorvastatin in type 2 diabetes in the Collaborative Atorvastatin Diabetes Study (CARDS): multicentre randomised placebo-controlled trial. Lancet. 2004;364(9435):685-696. [DOI] [PubMed] [Google Scholar]
- 36.Knopp RH, d’Emden M, Smilde JG, Pocock SJ. Efficacy and safety of atorvastatin in the prevention of cardiovascular end points in subjects with type 2 diabetes: the Atorvastatin Study for Prevention of Coronary Heart Disease Endpoints in non-insulin-dependent diabetes mellitus (ASPEN). Diabetes Care. 2006;29(7):1478-1485. [DOI] [PubMed] [Google Scholar]
- 37.Nakamura H, Arakawa K, Itakura H, et al. ; MEGA Study Group . Primary prevention of cardiovascular disease with pravastatin in Japan (MEGA Study): a prospective randomised controlled trial. Lancet. 2006;368(9542):1155-1163. [DOI] [PubMed] [Google Scholar]
- 38.Amarenco P, Bogousslavsky J, Callahan A III, et al. ; Stroke Prevention by Aggressive Reduction in Cholesterol Levels (SPARCL) Investigators . High-dose atorvastatin after stroke or transient ischemic attack. N Engl J Med. 2006;355(6):549-559. [DOI] [PubMed] [Google Scholar]
- 39.Armitage J, Bowman L, Wallendszus K, et al. ; Study of the Effectiveness of Additional Reductions in Cholesterol and Homocysteine (SEARCH) Collaborative Group . Intensive lowering of LDL cholesterol with 80 mg versus 20 mg simvastatin daily in 12,064 survivors of myocardial infarction: a double-blind randomised trial. Lancet. 2010;376(9753):1658-1669. [DOI] [PMC free article] [PubMed] [Google Scholar]
- 40.Yusuf S, Bosch J, Dagenais G, et al. ; HOPE-3 Investigators . Cholesterol lowering in intermediate-risk persons without cardiovascular disease. N Engl J Med. 2016;374(21):2021-2031. [DOI] [PubMed] [Google Scholar]
- 41.Rossebø AB, Pedersen TR, Boman K, et al. ; SEAS Investigators . Intensive lipid lowering with simvastatin and ezetimibe in aortic stenosis. N Engl J Med. 2008;359(13):1343-1356. [DOI] [PubMed] [Google Scholar]
- 42.Baigent C, Landray MJ, Reith C, et al. ; SHARP Investigators . The effects of lowering LDL cholesterol with simvastatin plus ezetimibe in patients with chronic kidney disease (Study of Heart and Renal Protection): a randomised placebo-controlled trial. Lancet. 2011;377(9784):2181-2192. [DOI] [PMC free article] [PubMed] [Google Scholar]
- 43.Ridker PM, Revkin J, Amarenco P, et al. ; SPIRE Cardiovascular Outcome Investigators . Cardiovascular efficacy and safety of bococizumab in high-risk patients. N Engl J Med. 2017;376(16):1527-1539. [DOI] [PubMed] [Google Scholar]
- 44.Schwartz GG, Bessac L, Berdan LG, et al. Effect of alirocumab, a monoclonal antibody to PCSK9, on long-term cardiovascular outcomes following acute coronary syndromes: rationale and design of the ODYSSEY outcomes trial. Am Heart J. 2014;168(5):682-689. [DOI] [PubMed] [Google Scholar]
- 45.Goodman S, Schartz GG, Bhatt DL, et al. Use of high-intensity statin therapy post-acute coronary syndrome in the ongoing ODYSSEY OUTCOMES trial of alirocumab, a proprotein convertase subtilisin/kexin type 9 monoclonal antibody, vs placebo: interim baseline data. Poster presented at: American College of Cardiology 66th Annual Scientific Session; March 17-19, 2017; Washington, DC. [Google Scholar]
- 46.Robinson JG, Huijgen R, Ray K, Persons J, Kastelein JJ, Pencina MJ. Determining when to add nonstatin therapy: a quantitative approach. J Am Coll Cardiol. 2016;68(22):2412-2421. [DOI] [PubMed] [Google Scholar]
Associated Data
This section collects any data citations, data availability statements, or supplementary materials included in this article.
Supplementary Materials
eTables 1-12
eFigures 1-22
eReferences