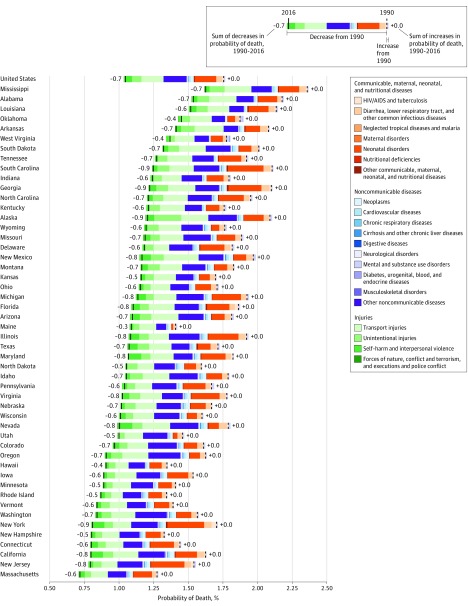
Figure 3. Change in the Probability of Death Between Birth and Age 20 Years, 1990-2016, Reported Showing Major Causes of Death for the United States Overall and the 50 States.
States are listed in descending order according to probability of death in 2016. Data for Washington, DC, were not included in this analysis.

