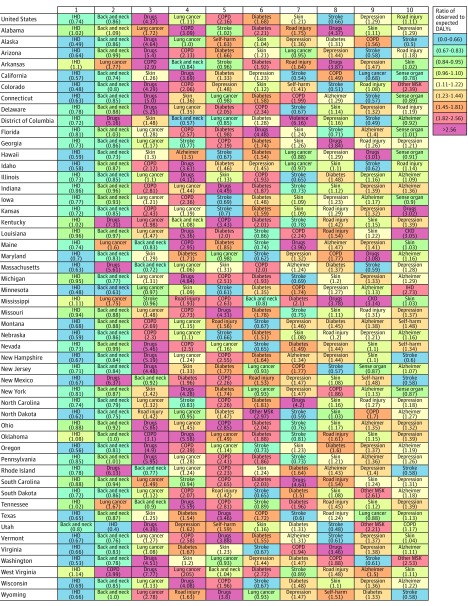
Figure 9. Ratio of Observed Disability-Adjusted Life-Years (DALYs) to Expected DALYs Based on the Sociodemographic Index (SDI) for the United States Overall, the 50 States, and the District of Columbia in 2016 for the 10 Leading Causes in Each Jurisdiction.
See Figure 7 caption for details. See Appendix Table 2 in Supplement 2 for explanation of terms.

