
Fig. 2.
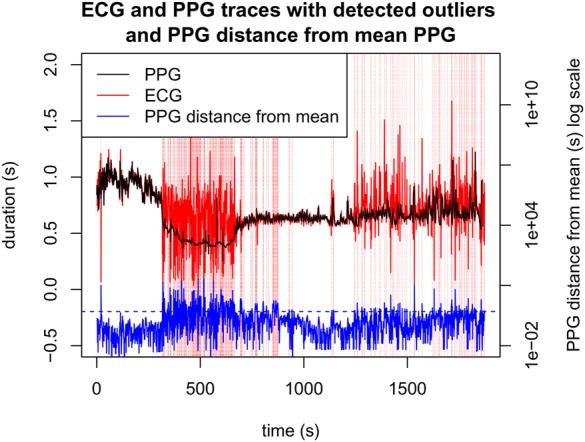
P–P intervals selected for removal (vertical red lines), and corresponding distance of instantaneous P–P interval from the 10 s moving average, as a percentage. The blue horizontal dotted line indicates the threshold for the distance to trigger an outlier detection