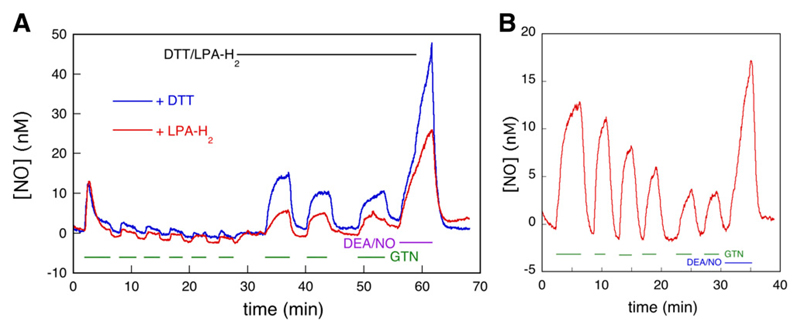
Fig. 3.
Comparison of the effects of DTT and LPA-H2 on NO generation from GTN by C301S/C303S-ALDH2 overexpressing VSMCs. (A) C301S/C303S-ALDH2 overexpressing VSMCs were perfused with 1 μM GTN, 10 μM DEA/NO, and 1 mM DTT (blue) or 0.5 mM LPA-H2 (red, n = 3, 15 traces) as indicated, and the NO concentration was monitored by fluorescence microscopy. See Materials and Methods for further details. The time course in the presence of DTT was taken from Fig. 1. (B) Exhaustion of DTT-supported NO generation. C301S/C303S-ALDH2 overexpressing VSMCs were perfused with 1 μM GTN or 10 μM DEA/NO as indicated, in the presence of 1 mM DTT. See Materials and Methods for further details.

