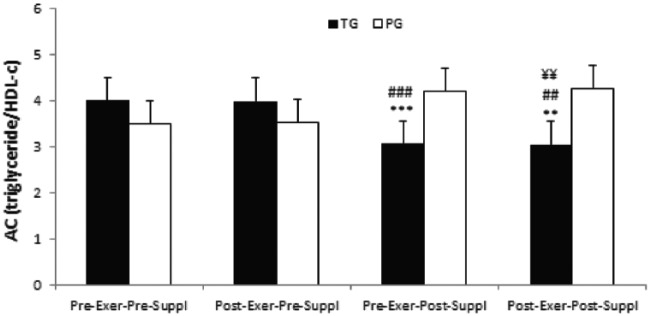
Figure 3.
AC index in TG and PG. Data are expressed as means ± SD.
AC, atherogenic coefficient; Exer, exercise; HDL-c, high-density lipoprotein cholesterol; PG, placebo group; SD, standard deviation; Suppl, supplementation; TG, taurine group.
***p < 0.001
**p < 0.01 versus Pre-Exer, Pre-Suppl in TG
###p < 0.001
##p < 0.01 versus Post-Exer, Pre-Suppl in TG
¥¥p < 0.01 versus Pre-Exer, Post-Suppl in TG

