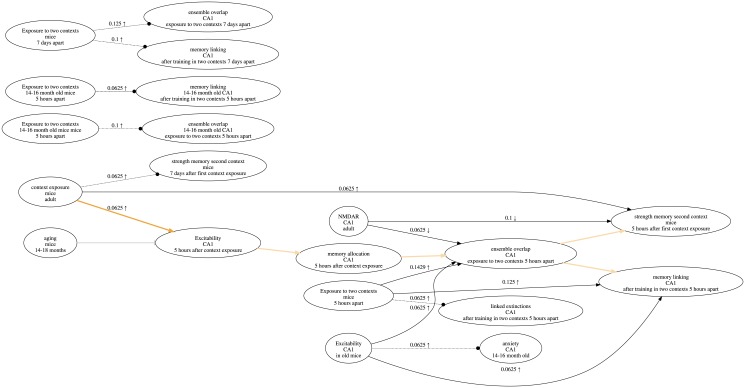
Fig 1. Research map of the results in a published article [8].
Each node in a research map has three properties: What (top), Where (middle), and When (bottom). Nodes are connected by edges that represent relations: Excitatory (sharp arrowhead), Inhibitory (blunt arrowhead), and No-connection (dotted line, circular arrowhead). Each empirical edge also has a score that reflects the amount of evidence represented, as well as symbols that reflect the experiment classes recorded for that edge. Scores and experiment symbols are not assigned to hypothetical edges. Users can highlight edges that reflect the main idea(s) discussed in the article, so that they are more apparent. In cases where no one relation has received dominant evidence, the corresponding edge is represented by a diamond arrowhead and is not assigned a score.

