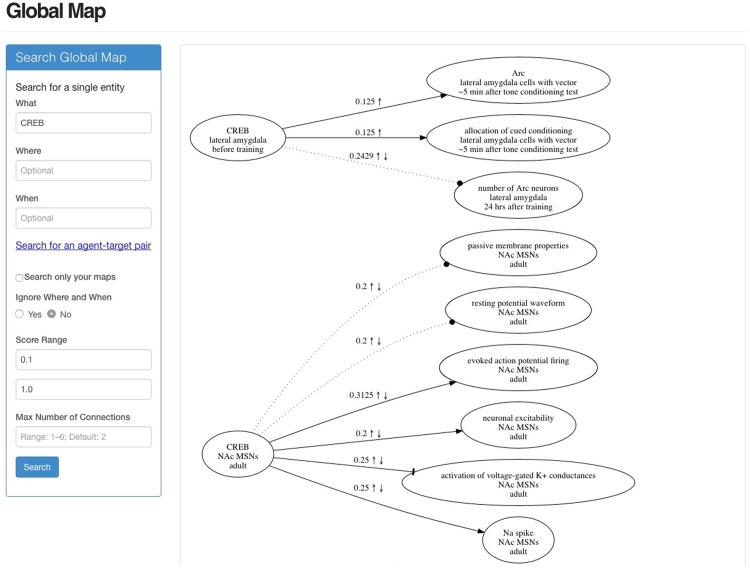
Fig 7. Interacting with the information in ResearchMaps.
This screenshot shows the interface used to interact with the information in the app. The panel on the left is used for entering the details for a particular query (e.g., CREB). The map shown on the right includes only a fraction of the edges that this query returned. This map represents integrated data from many different research articles.

