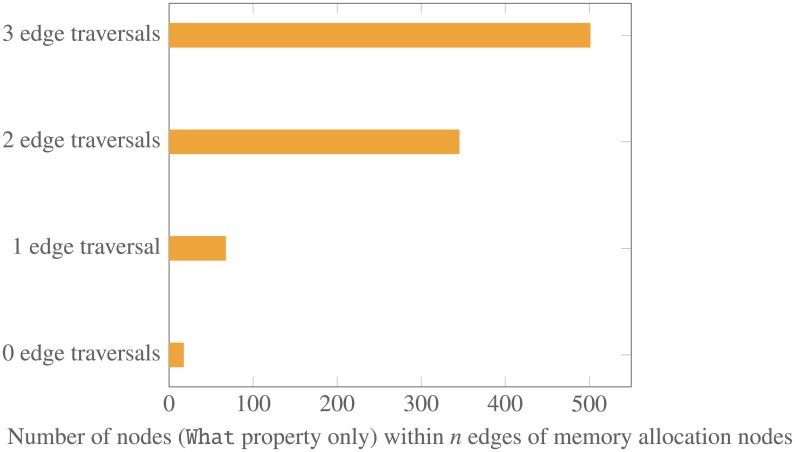
Fig 12. Connectivity characteristics in the Global Map for memory allocation.
The plot shows the surprisingly extensive connectivity between papers in memory allocation and other related work, which can be visualized in the Global Map of ResearchMaps. For example, the graph shows that within three edge traversals, there are over 500 nodes that connect with nodes in individual memory allocation research maps. This extensive connectivity provides abundant opportunities for hypothesis building, since any one of the connected nodes could modulate unknown features of memory allocation (and vice versa).

