
Fig 13. An example of how the structural information in a research map can help to identify conflicting results.
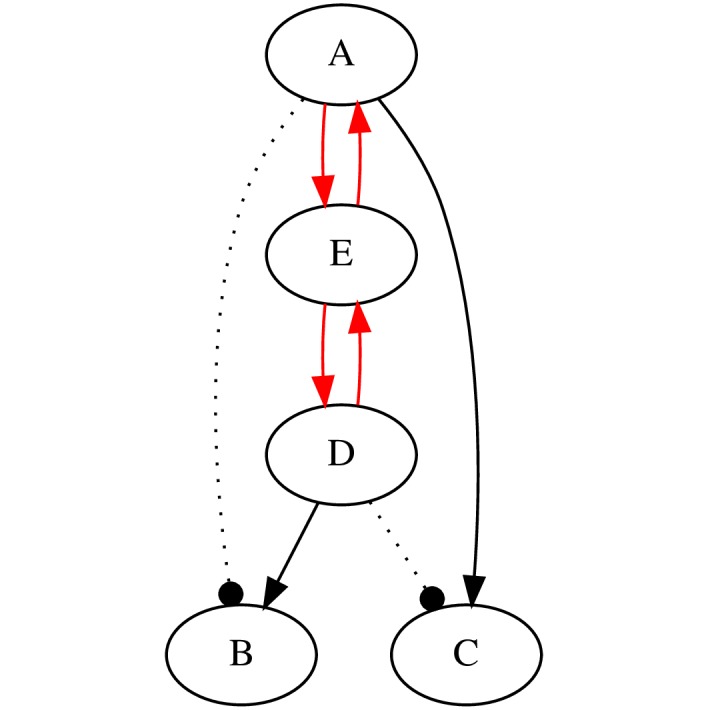
The edges in red are in conflict with the edges in black—all the edges cannot be true simultaneously. (For simplicity, the scores and experiment symbols in this research map have been omitted).