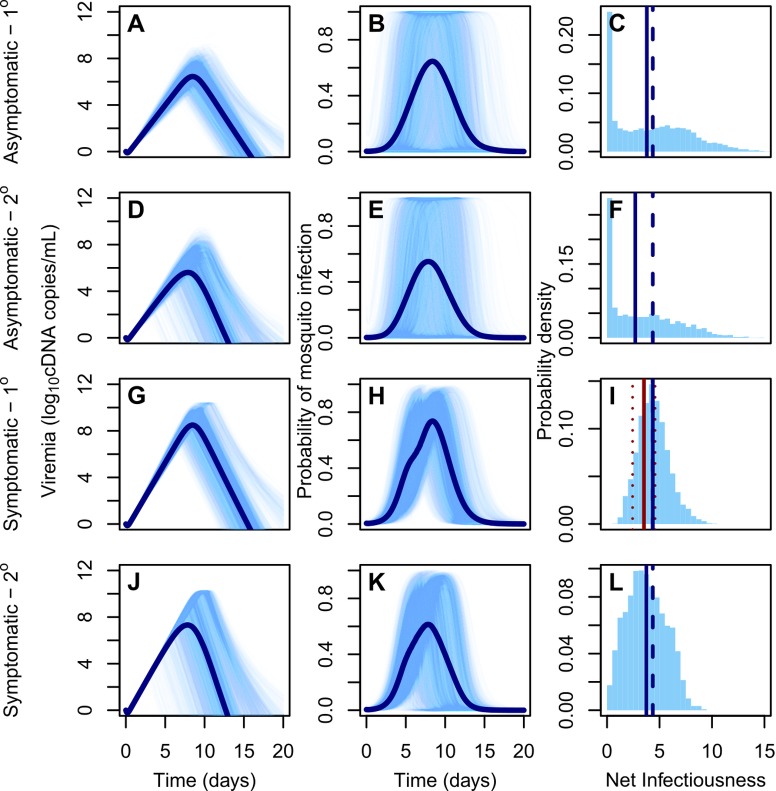
Fig 3. DENV viremia and infectiousness trajectories by infection class.
(A,D,G,J): DENV viremia since time of infection for different infection classes and pre-exposure histories (1°: primary infection; 2°: secondary infection). Lighter lines denote 3,000 replicates and dark lines means. (B,E,H,K): Infectiousness of humans to mosquitoes over time. (C,F,I,L): Probability density of net infectiousness as defined in Eq (4) based on curves from the middle column. The solid blue line denotes the median and the dashed line denotes the median for the reference group (1° symptomatic). The solid and dashed red lines denote the mean and 95% confidence interval of the net infectiousness of 1° symptomatic infections as measured empirically [63].

