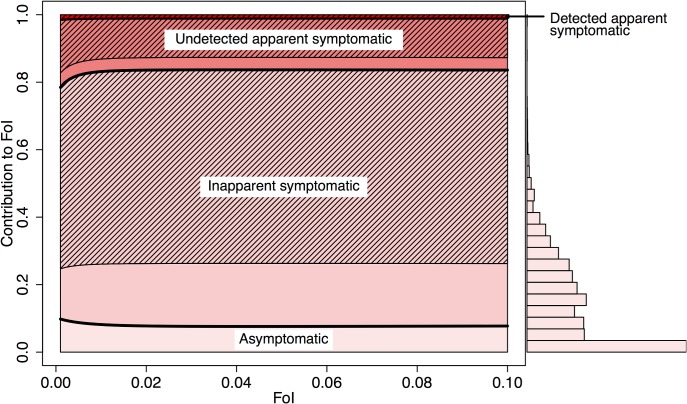
Fig 5. Mean contribution of each infection class to total force of infection (FoI).
The contribution to the total FoI of an infection class is derived from the ratio of FoI attributable to a given class and total FoI, as in Eq (1). The respective net infectiousness is derived from the 3,000 random samples displayed in Fig 3. The infections are further distributed according to the estimated proportion of net infectiousness to occur before and after symptom onset (pre-symptomatic (Eq (5)) and post-symptomatic (hatched lines) (Eq (6)). The histogram shows the distribution of FoI contributions by asymptomatic infections at FoI = 0.1, accounting for parameter uncertainty.

