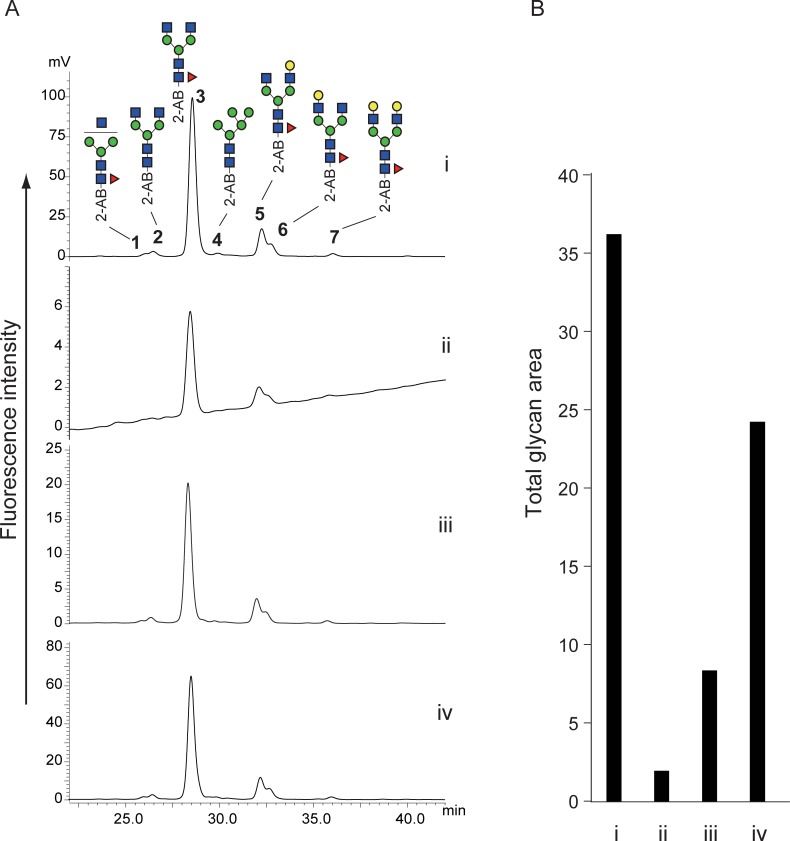
Fig 2. Comparison between alkaline de-N-glycosylation at 80°C for 1 h and PNGase F digestion.
(A) HPLC chromatograms of PNGase F digestion (i), alkaline de-N-glycosylation without hydroxylamine (ii), alkaline de-N-glycosylation with 5% hydroxylamine (iii), and alkaline de-N-glycosylation with 20% hydroxylamine (iv). (B) Comparison of glycan recovery. Bar graph indicates sum of all glycan peak areas in the HPLC chromatograms. All chromatograms were obtained by injection of equal volumes of glycan solution prepared from the same quantity of glycoproteins. The numbered peaks were determined by MS and MS/MS. Glycan structures are depicted using CFG graphical notation for glycans (http://www.functionalglycomics.org/static/consortium/CFGnomenclature.pdf).

