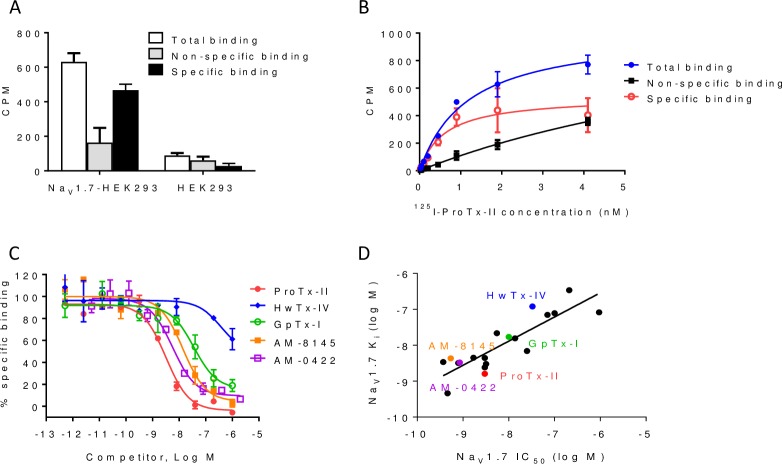
Fig 3. JzTx-V peptides displace 125I-ProTx-II binding to hNaV1.7 HEK293 cells.
A. Binding of 125I-ProTx-II (1.5 nM) to NaV1.7 HEK293 but not parental cells. Specific binding counts were displaced by cold AM-8145 (1 μM). B. Saturation curves for 125I-ProTx-II binding. Closed circles (blue) represent total binding, filled squares (black) represent non-specific binding, and open circles (red) represent specific binding, defined as the difference between total and non-specific binding. C. Competition binding curves with 0.5 nM 125I-ProTx-II in the presence of increasing concentrations of the indicated peptides. 125I-ProTx-II binding is competed by AM-8145, AM-0422, GpTx-1 and ProTx-II peptides. D. Correlation of NaV1.7 IC50 values by PX electrophysiology (x-axis) with Ki values for binding (y-axis) for a panel of reference and JzTx-V peptides (R2 of 0.74).

