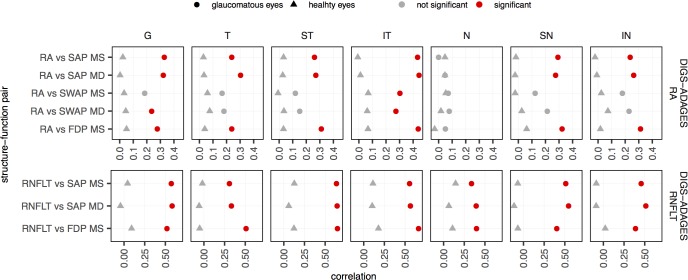
Fig 3. Pearson correlation for each of the structure-function pairs for DIGS-ADAGES dataset after restricting the range for glaucomatous eyes.
Results are presented globally and in all sectors for healthy (triangles) and glaucomatous (circles) eyes. Correlations that were found to be significantly different from zero after Bonferroni correction are shown in red. Note that the range of the x-axes are different for the different datasets; we plotted the graph using the range observed in each dataset to highlight the differences between healthy and glaucomatous eyes in each dataset.

