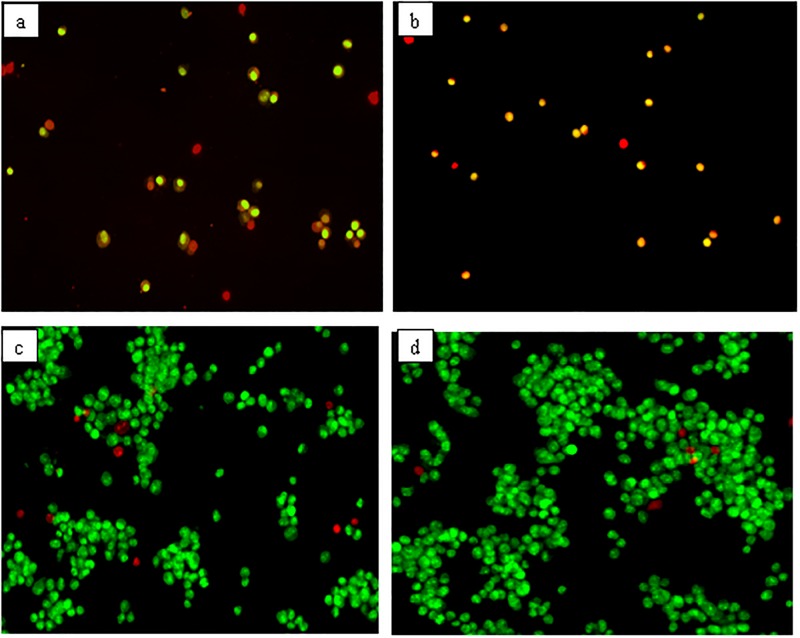
Fig 4. Acridine orange (AO, green) and propidium iodide (PI, red) double staining fluorescent micrographs of differentiated neuronal cells.
(a) 4 h H2O2 treated cells, (b) 72 h myrosinase pre-treated plus 4 h H2O2 exposed cells, (c) 72 h 1.25 μg/ml GMG-ITC pre-treated plus 4 h H2O2 exposed cells, (d) untreated cells (normal control). The images were captured in multiple times and x20 magnification was used.

