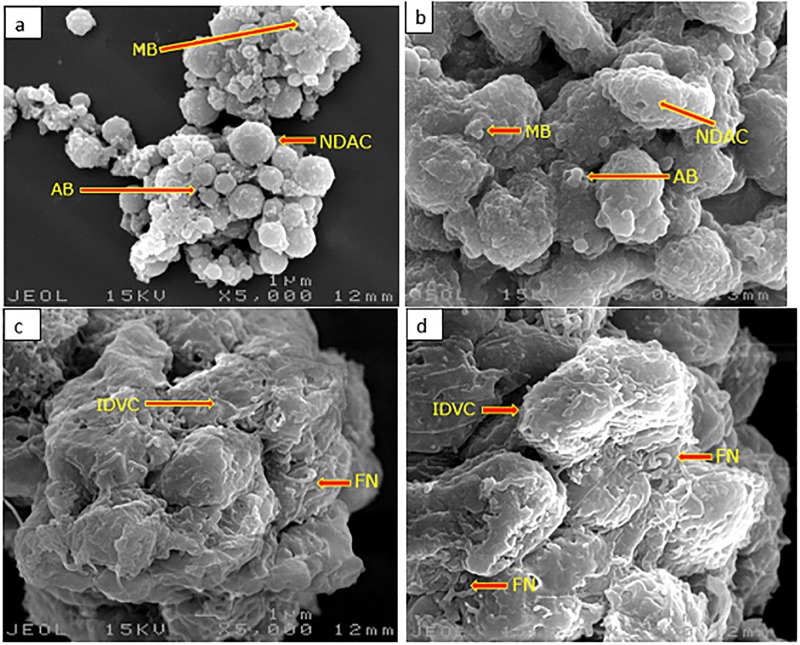
Fig 6. Surface morphological analysis of differentiated neuronal cells by scanning electron microscopy.
(a) 4 h H2O2 treated cells, (b) 72 h myrosinase pre-treated plus 4 h H2O2 exposure cells, (c) 72 h GMG-ITC pre-treated plus 4 h H2O2 exposure cells, (d) untreated (normal control) cells. AB = apoptotic body, IDVC = intact differentiated viable cells, FN = folded neurites, MB = membrane blabbing, NDAC = neurite disrupted apoptotic cells. Magnification (x 5000).

