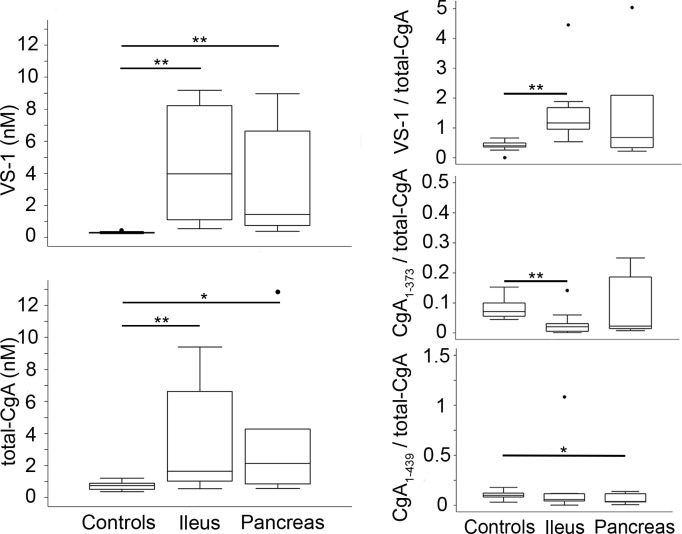
Fig 4. Plasma levels of VS-1 and total-CgA, VS-1/total-CgA, CgA1-373/total-CgA, and CgA1-439/total-CgA ratios (relative levels) in healthy subjects and patients with ileal and pancreatic NENs (case-control analysis by site).
Box-plots with median (middle line), 75th percentile (top line) and 25th percentile (bottom line). The top and bottom whiskers represent the upper and lower adjacent values, respectively. Values outside the whiskers are plotted individually (circles). Ileal NENs (n = 10); pancreatic NENs (n = 7); controls (n = 10). * (p < 0.05), **(p < 0.01), by analysis of covariance.

