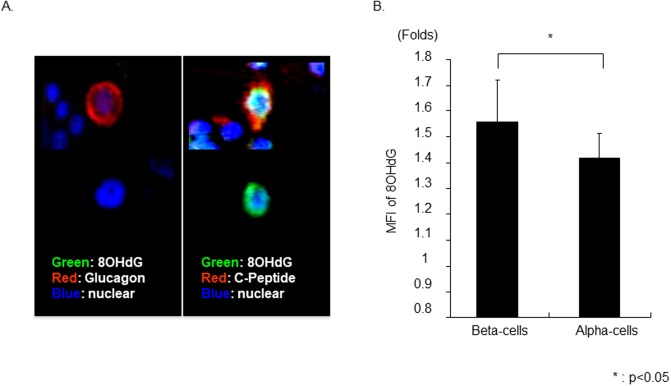
Fig 6. 8-hydroxy-2’-deoxyguanosine expression in α- and β-cell after oxidative stress.
(A) Representative photograph of α- and β-cell with or without expression of 8OHdG after giving oxidative Stress. 8OHdG expression in β- or α-cells was assessed using LSC/iCys. (B) The average MFI level of 8OHdG in α-or β- cell subset after exposure to H2O2 were calculated and compared to the vehicle (non-stimulated group). The amount of 8OHdG after oxidative stress significantly increased in β-cell, when compared to α-cell (N = 5).

