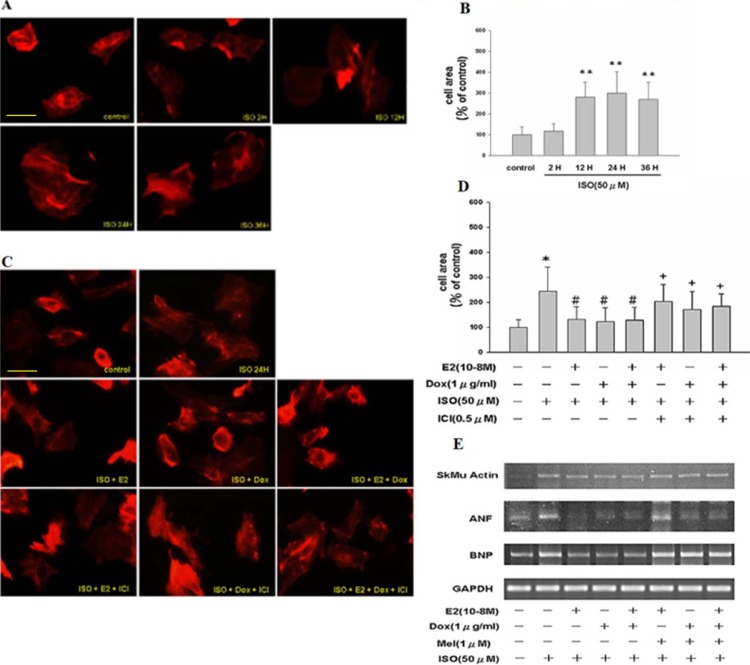
Fig 1. ISO treatment leads to hypertrophic cellular morphology in H9c2 cardiomyocytes in a time-dependent manner.
A, Fluorescence images of Tet-on/ERα H9c2 cells treated with ISO for 2 h, 12 h, 24 h and 36 h, respectively. As evident from actin staining, the cell surface area was enhanced after ISO stimulation in a time dependent manner. B, Quantification of cell surface area from above experiment. The bar graph represents data from three independent experiments and shows mean ± S.D. Student’s t–test was performed to arrive at significance. “**”, p < 0.01 for control versus ISO. C, Tet-on/ERα H9c2 cells were incubated with ISO, ISO plus E2 or Dox or ICI or combined treatments for 24 hours and actin staining was performed. E2 or Dox or combined treatment reduced the cell surface area, which was negated by ICI treatment. D, Tet-on/ERα H9c2 cell surface area from above experiments was quantified. The bar graph (mean ± S.D. of response) represents data from three independent experiments. 30 cells were counted per condition in each experiment. “*”, p < 0.05 for control versus ISO; “#”, or “+”, p < 0.05 for ISO versus combined treatments. E, Cells were incubated with ISO, ISO plus E2 or Dox or melatonin or combined treatments for 24 h. E2, Dox or both inhibit ISO-induced skeletal muscle actin, ANF, and BNP gene expression as measured by RT-PCR analysis, which was reversed by melatonin treatment (specific ERα inhibitor).

