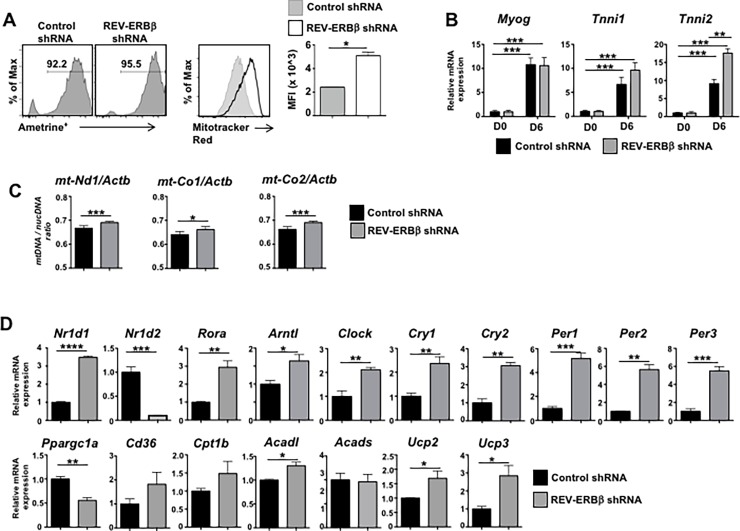
Fig 3. REV-ERBβ knock down drives mitochondrial gene expression in vitro.
(A) Mitochondrial biogenesis determined by flow cytometry (FACS) using MitoTracker Red staining in empty vector and REV-ERBβ shRNA overexpressing C2C12s. FACS panels (left) indicate percent of cells retrovirally transduced. FACS panels (middle) demonstrate knock down of REV-ERBβ enhances MitoTracker Red staining. Graph (right) depicts median fluorescent intensity (MFI). (B) qRT-PCR analysis of genes demonstrating cells had terminally differentiated. (C) Mitochondrial DNA (mtDNA) content demonstrated by the ratio of mtDNA to nuclear DNA (nucDNA) in CD8 shRNA versus REV-ERBβ shRNA overexpressing C2C12s. nucDNA was measured using ß-actin (Actb) primers. (D) qRT-PCR analysis demonstrating the knock down of REV-ERBβ and its effects on RORα, REV-ERBα, and genes encoding proteins involved in fatty acid oxidation and cytokine production. 18s was used as the internal control. (n = 3 per condition). Values are mean±s.e.m. Data representative of 4 independent (Panels A, B, D) or two independent (Panel C) experiments demonstrating similar results. Statistical significance was assessed using Student’s two-tailed t-tests. *p<0.05, ** p<0.01, *** p<0.005, **** p<0.001.

