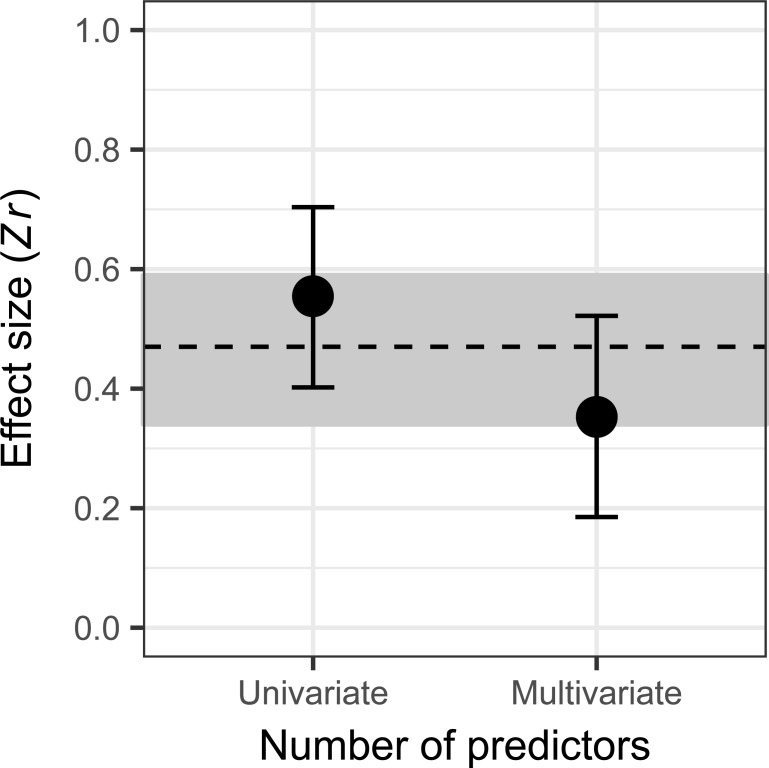
Fig 1. Differences in the effect size (Zr) for levels of the most influential moderator variable (‘Number of predictors’) in explaining heterogeneity in the complete dataset (n = 96; ΔLOO-IC relative to Intercept-only model = 3.4; Table A in S1 Text).
The dashed line shows the mean population-level effect size (0.47), and the grey bands show the 95% CI (0.34–0.59). CI, credible interval; LOO-IC, leave-one-out cross-validation information criterion; Zr, Fisher’s z-transformed correlation coefficient.

