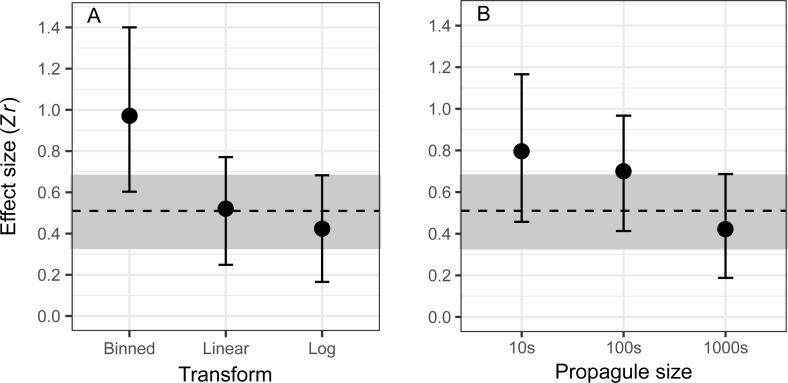
Fig 2. Differences in the effect size for levels of the most influential moderator variables in explaining heterogeneity in the ‘Propagule size’ dataset (n = 56; ΔLOO-IC relative to Intercept-only model = 2.81; Table C in S1 Text).
Transform (A) is the form of the propagule pressure variable in its measured relationship with establishment success, and Propagule size (B) is the number of individuals in log10 increments. Effect size estimates are conditional on the other moderators. The dashed line shows the mean population-level effect size (0.51) for the ‘Propagule size’ dataset, and the grey bands show the 95% CI (0.33–0.68). CI, credible interval; LOO-IC, leave-one-out cross-validation information criterion; Zr, Fisher’s z-transformed correlation coefficient.

