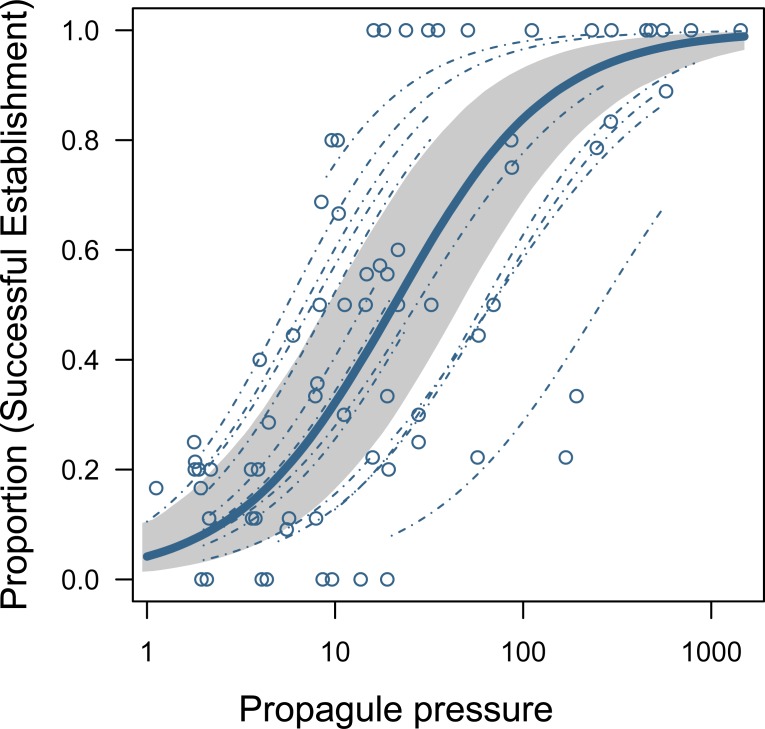
Fig 3. Estimated relationship of establishment success with propagule pressure and 95% CI (shaded).
Dashed lines are individual experimental relationships based on a logistic model with random variation in the intercept and slope among individual experiments. Note, there was no statistical evidence for (i) the model with random intercept and slopes performing better than the random Intercept-only model nor for (ii) different slopes between invertebrates and vertebrates (taxon [= n]; invertebrate = 9, vertebrate = 5; slope difference = 0.13, 95% CI = -0.9–1.2). Data points are raw data from 14 relationships from 11 studies (see S2 Text) that experimentally tested associations between propagule size and establishment probability (see Materials and methods for more details). CI, credible interval.

