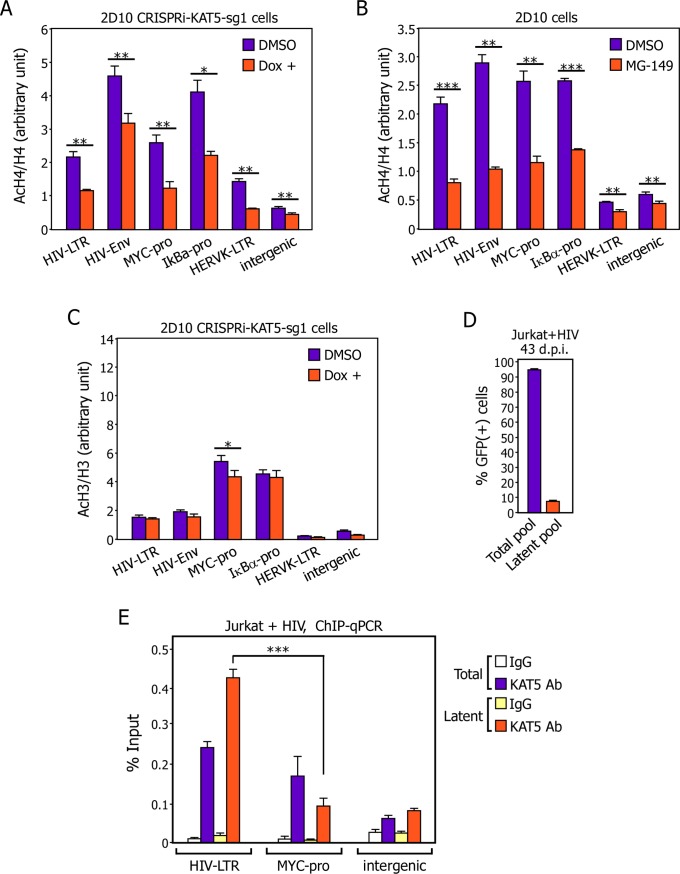
Fig 4. Antagonizing KAT5 reduces AcH4 but not AcH3 level on both HIV and non-HIV gene promoters and a higher level of KAT5 exists on the viral LTR than on the cellular MYC gene promoter in latently infected cells.
A., B., & C. The 2D10-based CRISPRi-KAT5-sg1 (A & C) and parental 2D10 (B) cells were treated with the indicated drugs and subjected to ChIP-qPCR assays to determine the levels of AcH3, AcH4, total H3 and total H4 bound to the various genomic locations labeled at the bottom. The ChIP-qPCR signals were normalized to those of input DNA for each genomic location and the ratios of AcH3 over H3 and AcH4 over H4 were shown. The error bars represent mean +/- SD from three independent qPCR reactions. The asterisks (*: p<0.05, **: p<0.01, and ***: p<0.001) indicate different levels of statistical significance as calculated by two-tailed Student’s t-tests. D. The total and latently infected Jurkat cell pools generated in Fig 1A were analyzed by FACS to determine the percentage of GFP(+) cells in each population. The error bars indicate mean +/- SD from three independent measurements. E. The indicated cell pools from D were subjected to ChIP-qPCR analysis with the anti-KAT5 antibody to determine the levels of KAT5 bound to the various genomic locations labeled at the bottom. The ChIP-qPCR signals were normalized to those of input DNA for each location and shown as an average of three independent reactions, with the error bars representing mean +/- SD and the asterisks indicating the levels of statistical significance calculated by two-tailed Student’s t-test.

