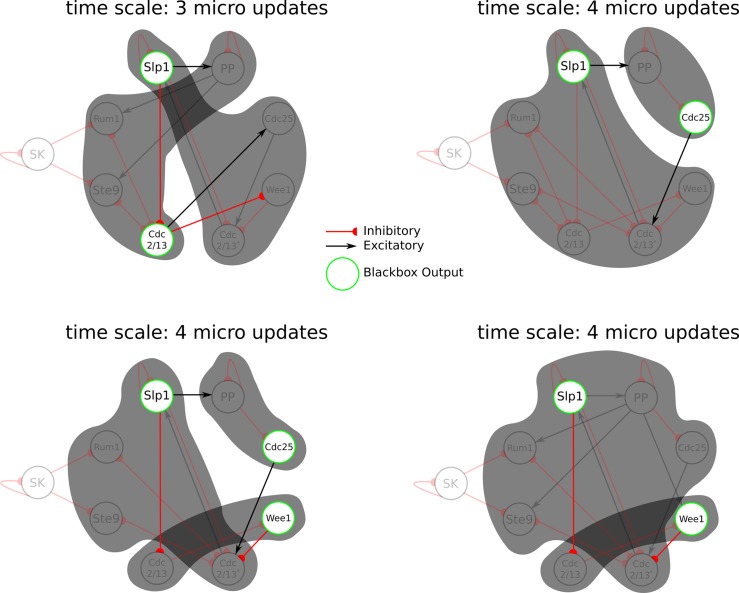
Fig 9. All stable local maxima of macro cause-effect power for the cell-cycle network over the course of its biological sequence.
Stable local maxima are identified at two different time scales (over 3 or 4 micro updates) and with groupings of the eight micro elements into either two or three macro elements. The output element for each black box is marked by a green outline; one common feature among all of the stable maxima is that element Slp1 acts as an output element of one black box. Note that connections between black boxes that do not originate from output elements are not shown in the figure because they do not contribute to the cause-effect structure (see S3 Text).

