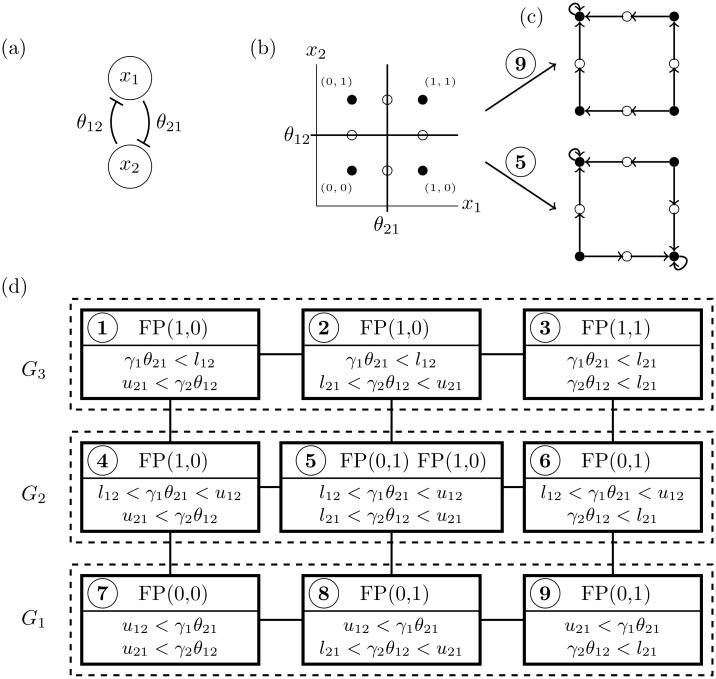
Fig 2. DSGRN for toggle switch.
(a) Regulatory network for the toggle switch. (b) Thresholds {θ2,1, θ1,2} divide phase space, (0, ∞)2, into four 2-dimensional domains (black dots) and 1-dimensional walls separating the domains (circles). (c) For each choice of parameters, given a domain there is a well-defined direction of dynamics at walls that defines the state transition graph (see Fig 6 for the derivation of this dynamics). State transition graph for parameters in regions 5 and 9 of the parameter graph. The Morse graph for 9 consists of a single node FP(0, 1) where FP indicates that the node is terminal in the Morse graph (a trivial statement for this simple example) and that the vector representation of the associated region is (0, 1). The Morse graph for 5 contains two nodes FP(0, 1) and FP(1, 0). (d) Visual interpretation of SQL DSRGN database for toggle switch organized as a parameter graph with explicit description of parameter domains (inequalities in bottom of each square) and Morse graphs (top part of each square) valid over corresponding parameter domain. Dashed boxes indicate elements of PG(¬1) = {G1, G2, G3}.

