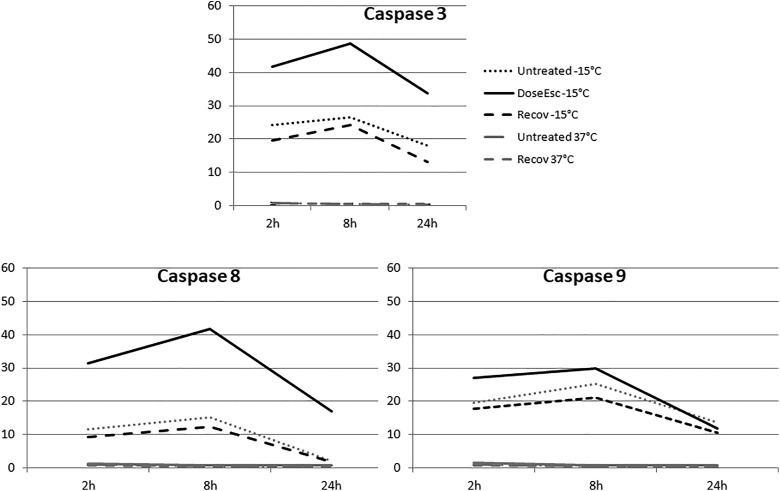
Figure 3.
Time course graphical analysis of positively labeled caspase 3, 8, and 9 following VD3 treatment and/or freezing to −15°C. Number of cells staining positive for each antibody were divided by the total number of Hoechst staining cells to determine the percentage of positively staining cells in each population. Three separate images per well were obtained and data from 3 separate immunofluorescence experiments were combined.

