. 2018 Apr 18;26:e20170329. doi: 10.1590/1678-7757-2017-0329

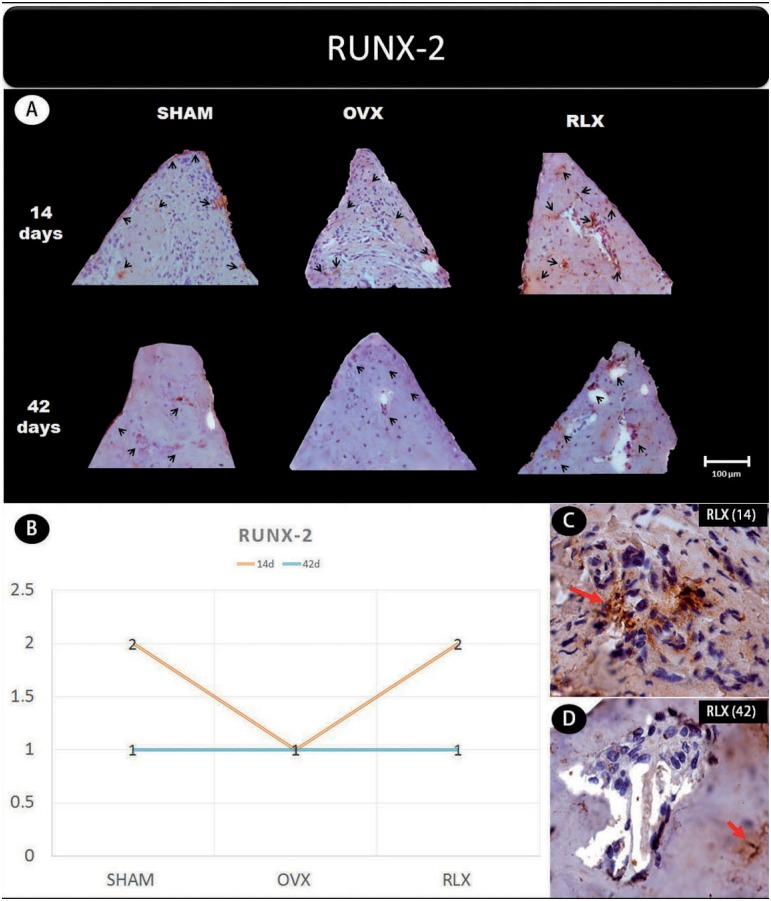
Figure 3. (A) Photomicrographs in a higher original objective (x40) of the different groups (SHAM, OVX, and RLX) and periods (14 and 42 days), in which is possible to observe an increased area of diaminobenzidine-stained cells (brown areas) around the peri-implant bone where the biomarker RUNX-2 were intense, represented by black arrow, denoting a greater active of the osteoblastogenesis; (B) The chart shows the scores submitted to the Kappa test, in which the index was adjusted to >0.8, representing the expression of RUNX-2 among the groups and in both periods; (C and D) Photomicrographs in a higher original objective (x100) about the 14 and 42 days of peri- implant bone healing from RLX group showing a moderate labeling for 14 days and middle labeling for 42 days of the biomarker RUNX-2 represented by red arrows.

Figure 3