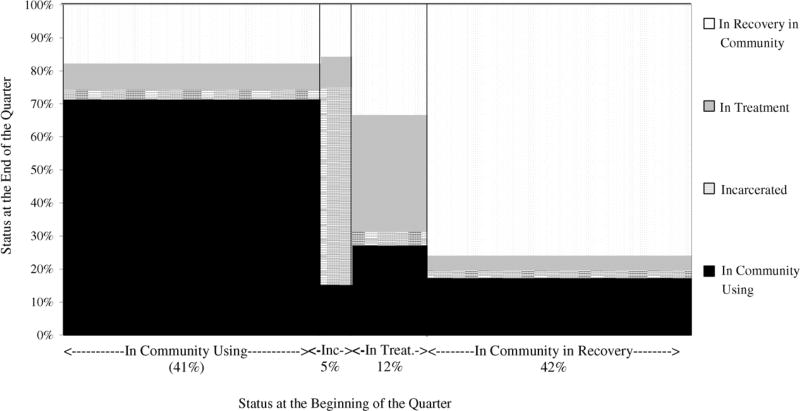
Fig. 2.
Average pattern of stability and transition in status per quarter (n = 448). In any given quarter, an average of 32% change status, ranging from 24% of those starting in recovery to 65% of those starting in treatment. This chart illustrates the average pattern of change each quarter in Table 2. The width of each group shows the percent of people in each status at the beginning of the quarter. The stacked bar shows the (column) percent that ended up in each status.

