
Figure 3. piRNA-mediated chromatin changes regulate P-element splicing.
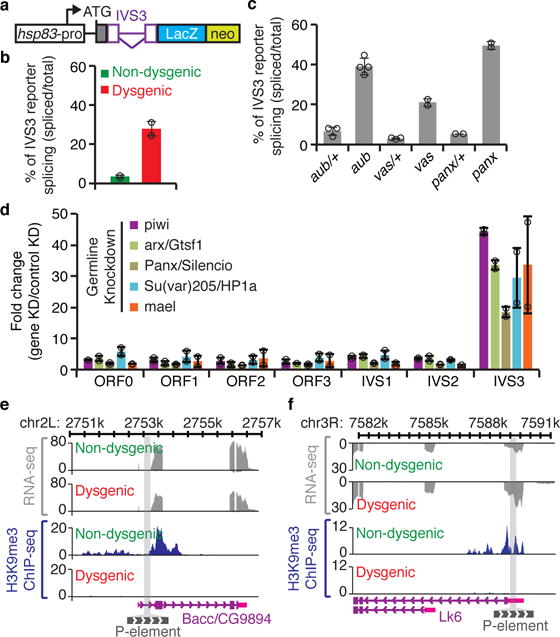
a, Diagram of IVS3 transgenic reporter20: white box, germline-specific hsp83 promoter; ATG, codon start; gray box, nuclear localization signal; purple, P-element fragment containing IVS3 (inverted triangle) and exonic flanking sequences (boxes); blue box, LacZ; green box, neo. b, RT-qPCR analysis using adult ovaries of [F1] progeny originated from reciprocal crosses between Harwich strain and w1118 flies carrying the IVS3 reporter. Bars represent the percentage of spliced IVS3 reporter transgenic transcripts, determined by the ratio between IVS3 spliced transgenic RNA (quantified using primers that specifically anneal to spliced transgenic transcripts) and total IVS3 reporter transgenic mRNA (quantified using primers that anneal within the LacZ coding sequence). Results are presented as means of spliced transgenic RNA (percentage) ± standard deviation (n=2 independent biological replicate experiments). c, RT-qPCR analysis in aub/+ heterozygous, aub mutant, vas/+ heterozygous, vas mutant, panx/+ heterozygous, and panx mutant, carrying the transgenic IVS3 reporter. All experiments were performed in a Harwich background (n>=2 independent biological replicate experiments). Results are represented as in (b). d, RT-qPCR analysis on adult ovaries of germline knockdowns (KD) targeting piRNA pathway components involved in chromatin targeting (piwi, arx/Gstf1, Panx/Silencio, Su(var)205/HP1a, and mael). Results are presented as means of fold changes in germline KDs in relation to controls (white or mCherry germline KDs) ± standard deviation. All analyses were performed in a Harwich background (n>=2 independent biological replicate experiments). e-f, Genome browser view of two of the P-element insertions showing transcriptional activity. Normalized RNA-seq and H3K9me3 ChIP signals are presented in gray and blue, respectively. The gray bar crossing the plots represents P-element chromosomal insertion site. Annotation is at bottom: purple boxes, coding exons; pink boxes, untranslated regions (UTR); purple lines, introns; gray box, P-element insertion. View showing P-element insertion into Bacc/CG9894 (e) and Lk6 (f) genes.