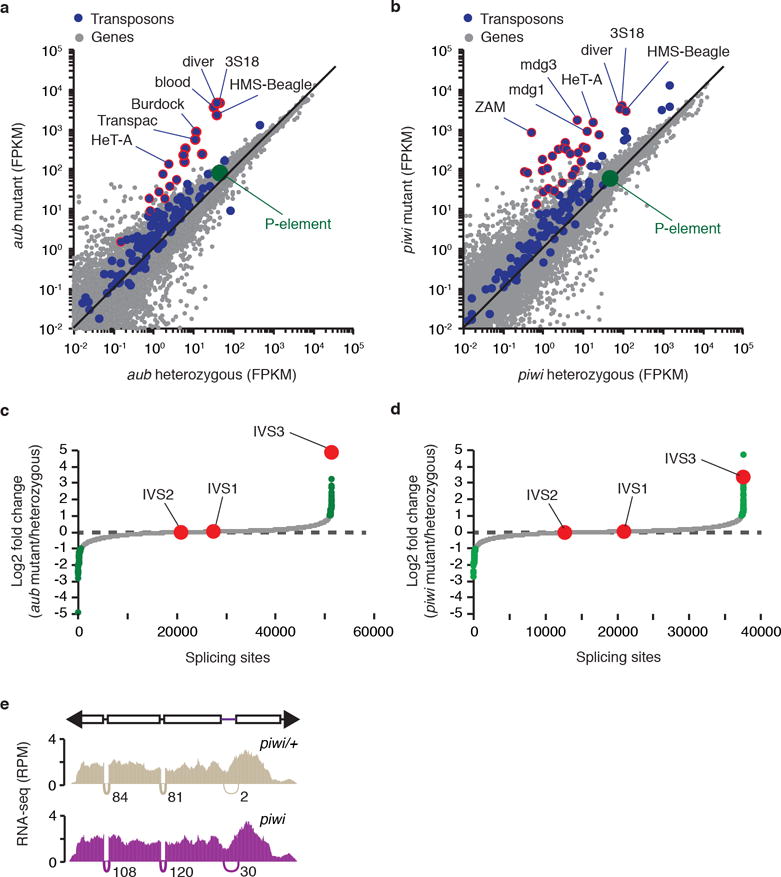
Extended data Figure 2. P-element mRNA steady-state levels do not change in piRNA mutants in comparison to respective heterozygous.

a-b, Scatterplots showing the expression of genes (gray dots) and transposons (blue dots), as measured by RNA-seq analysis (expressed in fragments per kilobase per million fragments, FPKM, log10), in aub/+ heterozygous vs. aub mutant adult ovaries (a) and piwi/+ heterozygous vs. piwi mutant adult ovaries (b) comparisons. P-element expression is shown in green. Transposons with RNA abundance changes >10-fold are outlined in red. Experiments were repeated two times with similar results. c-d, Genome-wide analysis of splicing changes in aub/+ heterozygous vs. aub mutant adult ovaries (c) and piwi/+ heterozygous vs. piwi mutant adult ovaries (d) comparisons. Quantification of splicing changes was performed using RNA-seq data and the JUM method44,45. Results are expressed as log2 fold changes in splicing (mutant/heterozygous). Gray dots represent individual splice junctions identified, sorted by fold change values. Green dots represent splice junctions with statistically significant changes in heterozygous vs. mutant comparisons (adjust p-value < 0.05). Fold changes for P-element splice junctions (IVS1, IVS2, and IVS3) are presented in red. Note that ~70% of genic splice junctions showing statistically significant changes in mutant comparisons (green dots) are located in the same chromosome as the inducing mutations (2nd chromosome), and may be due to genetic background differences. e, Density plots for normalized strand-specific mRNA steady-state levels (measured by RNA-seq and represented as reads per million, RPM) over consensus P-element sequence (top diagram) in piwi/+ heterozygous (beige, top plot) and piwi mutant (purple, bottom plot) adult ovaries. The number and position of split-reads (represented by arcs that connect exons) observed for IVS1, IVS2, and IVS3 splicing junctions is shown below each density plot. Experiments were repeated two times with similar results.
