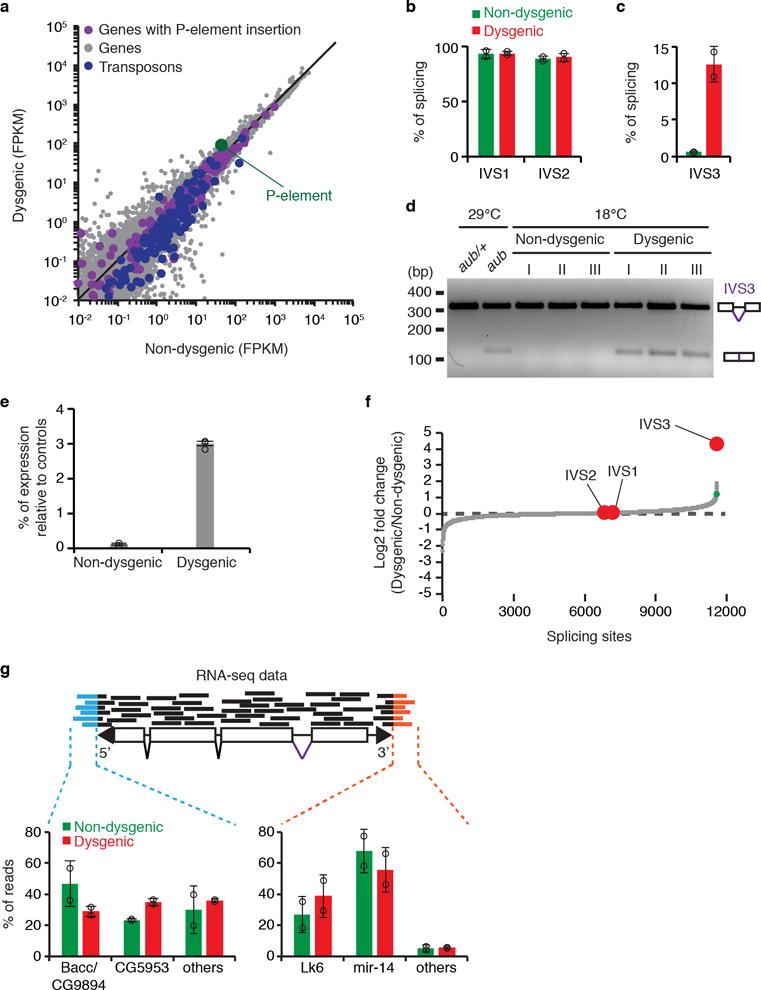
Extended data Figure 6. Analysis of P-element expression and splicing in adult ovaries of non-dysgenic and dysgenic progeny grown at 18°C.

a, Scatterplot showing the expression of genes (gray dots) and transposons (blue dots), as measured by RNA-seq analysis (expressed in fragments per kilobase per million fragments, FPKM, log10), in adult ovaries of non-dysgenic vs. dysgenic progeny grown at 18°C. P-element expression is shown in green. Genes containing P-element insertion in Harwich strain are depicted in purple. b-c, Percentage of splicing for P-element IVS1, IVS2 (b), and IVS3 (c) splicing junctions as determined by RNA-seq analysis in non-dysgenic (green) and dysgenic (red) adult ovaries. Bars represent percentage of splicing, calculated as the number of split-reads for each splicing junction normalized to the total number of reads mapping to the same junction. Results are represented as means ± standard deviation (n=2 independent biological replicate experiments). d, Ethidium bromide-stained gel displaying RT-PCR reactions with primers flanking the P-element IVS3 intron in adult ovaries of non-dysgenic and dysgenic progeny grown at 18°C, as well as aub/+ heterozygous and aub mutant grown at 29°C. Size scale in base pairs (bp) is presented for each gel. As shown, experiments were repeated three times with similar results. For gel source data, see Supplementary Figure 1. e, RT-qPCR analysis testing accumulation of IVS3 spliced mRNA on non-dysgenic and dysgenic progeny (ovaries) grown at 18°C. Results are expressed as means of percentage of expression relative to controls ± standard deviation (n=3 independent biological replicate experiments). f, Genome-wide analysis of splicing changes in in adult ovaries of non-dysgenic vs. dysgenic progeny grown at 18°C. Quantification of splicing changes was performed using RNA-seq data and the JUM method44,45. Results are expressed as log2 fold changes in splicing (dysgenic/non-dysgenic). Gray dots represent individual splice junctions identified, sorted by fold change values. Green dots represent splice junctions with statistically significant changes in heterozygous vs. mutant comparisons (adjust p-value < 0.05). Fold changes for P-element splice junctions (IVS1, IVS2, and IVS3) are presented in red. g, Analysis of RNA-seq data obtained from non-dysgenic (green) and dysgenic (red) progeny (adult ovaries) to identify transcriptionally active P-element insertions. Reads partially mapping to the P-element extremities were subsequently mapped to the Drosophila genome. Results are expressed as percentage of reads mapping to a given genomic location in relation to total reads. Bars represent means ± standard deviation (n=2 independent biological replicate experiments). All experiments were performed with ovaries of adult progeny from non-dysgenic and dysgenic crosses grown at 18°C.
