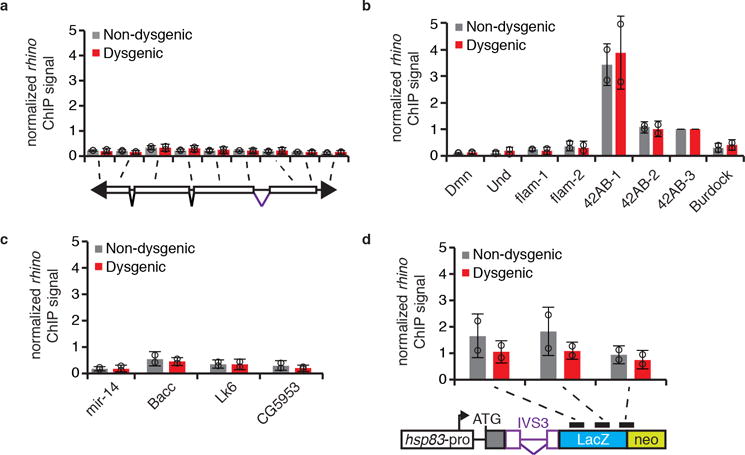
Extended data Figure 8. rhino ChIP-qPCR analysis in adult ovaries of non-dysgenic and dysgenic progeny grown at 18°C.

rhino ChIP-qPCR analysis on P-element (a), controls (b), sequences flanking transcriptionally active P-insertions in the Harwich strain (c), and transgenic IVS3 splicing reporter (d) in non-dysgenic (grays) and dysgenic (red) progeny. Bars represent means of Rhino signal, normalized to a control genomic region in the 42AB locus (42AB-3), ± standard deviation (n=2 independent biological replicate experiments). b, Dmn, Und, and flam are negative controls; 42AB is a positive control. d, Diagram of transgenic IVS3 splicing reporter is presented below the graph. Black rectangles indicate regions probed by ChIP-qPCR. All experiments were performed with ovaries of adult progeny from non-dysgenic and dysgenic crosses grown at 18°C.
