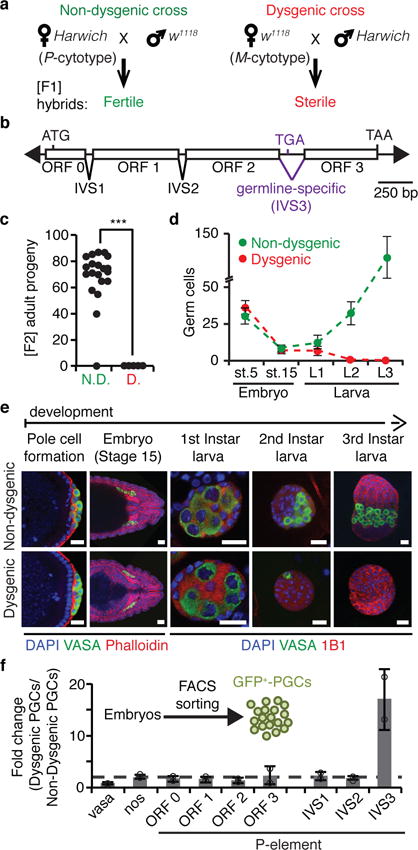
Figure 1. P-element DNA transposon splicing is regulated in germ cells during hybrid dysgenesis.

a, P-M hybrid dysgenesis crossing scheme. P-cytotype designates animals containing P-elements, and M-cytotype those lacking them. Harwich strain contains P-element while w1118 strain does not. b, Diagram of P-element DNA transposon. Arrowheads represent terminal inverted repeats; boxes, exons (ORF0-3); inverted triangles, introns (IVS1-3); ATG, start codon; TGA and TAA, stop codons. c, Fertility of non-dysgenic (N.D.) and dysgenic (D.) flies as measured by the number of [F2] adult progeny originated from single [F1] female crosses. (n=20 independent crosses). ***p < 0.0001 (Mann–Whitney–Wilcoxon test). d, Number of germ cells during embryonic and larval stages in non-dysgenic (green) and dysgenic (red) [F1] progeny. Dots represent means ± standard deviation. Stage 5 (st.5): complete germ cell count; Stage 15 (st.15) and later stages: germ cell count/gonad. Embryo st.5 (n=28 embryos); embryo st.15 (n>30 gonads); larva L1 (n>10 gonads); larva L2 (n=7 gonads); larva L3 (n>10 gonads). e, Representative confocal images of germ cell development in non-dysgenic and dysgenic progeny during embryonic and larval stages. Embryos and larvae were stained for: Vasa (germ cells, green); DAPI (DNA, blue); Phalloidin (F-Actin, red; embryo stages); 1B1 (somatic cells and spectrosomes, red; larval stages). Pole cell formation, ~1.5h After Egg Laying (AEL); Embryo Stage 15: 10-12h AEL; First Instar larva: 22-48h AEL; Second Instar larva: 48-72h AEL; Third Instar larva: 72-120h AEL. Scale bars, 20 μM. Experiments were repeated three or more times with similar results. f, RT-qPCR analysis on FACS-sorted primordial germ cells (GFP+-PGCs) from 4- to 20-hours-old embryos generated from reciprocal crosses between w1118 and Harwich. Results are represented as means of fold changes in dysgenic GFP+-PGCs in relation to non-dysgenic GFP+-PGCs ± standard deviation (n=2 independent biological replicate experiments).
