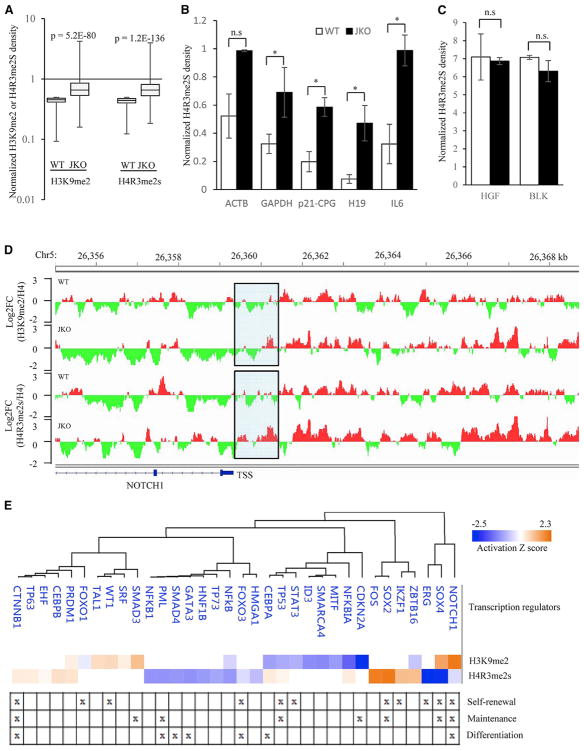
Figure 5. JMJD1B Maintains Demethylation Status of H4R3me2s and H3K9me2 at the Promoter Regions of Distinct Clusters of Genes in HSPCs for Hematopoiesis.
(A) Box-and-whisker plots of H3K9me2/H4 and H4R3me2s/H4 signal changes between the mutant and WT HSPCs at the promoter regions of genes that are depleted of H3K9me2 or H4R3me2s in the WT HSPCs. The depleted genes are defined as those with log2FC (H3K9me2/H4) or log2FC (H4R3me2s/H4) ≤ −1 in the WT HSPCs.
(B and C) ChIP-qPCR measurement of H4R3me2s occupancy at H4R3me2s-depleted genes (B) and the non-depleted genes (C) in WT and JMJD1B−/− cells. The ChIPed H4R3me2s signal was normalized with the corresponding ChIPed H4 signal and was expressed as percentage of ChIPed H4. Values are mean ± SEM of three ChIP experiments. *p < 0.05 (Student’s t test).
(D) Representative IGV view of the H4R3me2s and H3K9me2 ChIP signals normalized to the H4 ChIP signal in the promoter region of a depleted gene (e.g., NOTCH1 gene). The promoter region was defined as the region from the transcription start site (TSS) to 1 kb upstream of the TSS (highlighted). The depleted or enriched regions are specified by green or red color.
(E) IPA upstream analysis predicts different transcription factors corresponding to the overlapped genes as defined in (D). The transcription factors with p < 0.01 and a calculated Z score are shown. The roles of different transcription factors in the self-renewal, maintenance, and differentiation are specified.
See also Figures S3 and S4.

