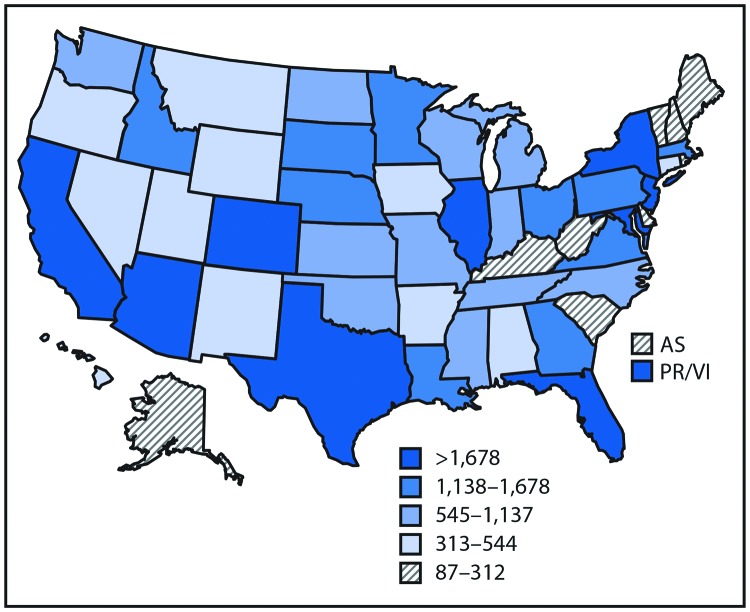
FIGURE 2.
Reported cases* of mosquitoborne disease — U.S. states and territories, 2004–2016
Sources: CDC, National Notifiable Diseases Surveillance System, 2016 Annual Tables of Infectious Disease Data. https://wwwn.cdc.gov/nndss/infectious-tables.html. CDC, Division of Health Informatics and Surveillance. CDC, ArboNET.
Abbreviations: AS = American Samoa; PR/VI = Puerto Rico/U.S. Virgin Islands.
* Data classified by quintile.

