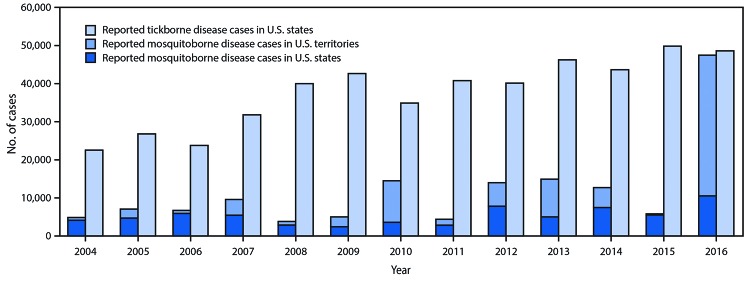
FIGURE 3.
Reported nationally notifiable mosquitoborne,* tickborne, and fleaborne† disease cases — U.S. states and territories, 2004–2016
* Mosquitoborne case counts include both locally transmitted and travel-associated cases. Only 305 arbovirus cases were reported from the territories in 2015.
† A total of 89 fleaborne disease cases (plague) were reported during 2004–2018, ranging from two cases in 2010 to 16 cases in 2015. The cases are not depicted on the figure.

