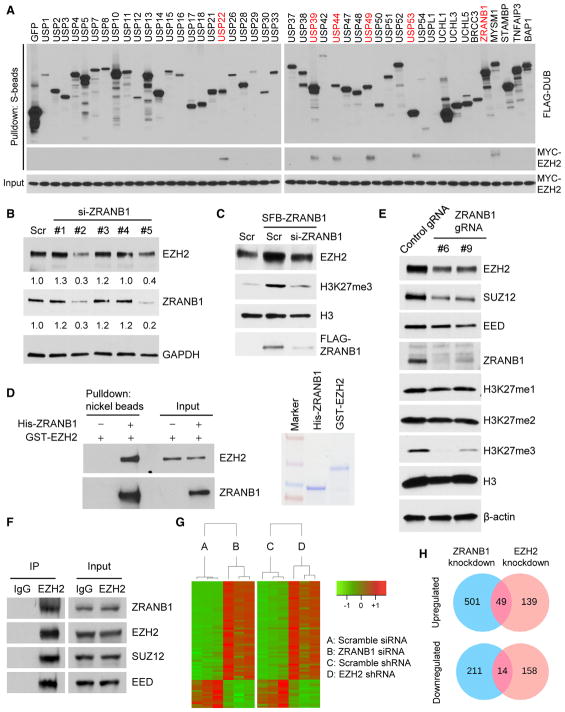
Figure 1. ZRANB1 Regulates EZH2 Protein Level.
(A) Six of 46 DUBs physically associate with EZH2. Each SFB-tagged DUB was co-transfected with MYC-tagged EZH2 into HEK293T cells, followed by pull-down with S-protein beads and immunoblotting with antibodies against FLAG and MYC.
(B) Immunoblotting of EZH2, ZRANB1, and GAPDH in MDA-MB-231 cells transfected with ZRANB1 siRNA or a scramble control (Scr).
(C) Immunoblotting of EZH2, H3K27me3, H3, and FLAG-ZRANB1 in HEK293T cells transfected with SFB-ZRANB1 and ZRANB1 siRNA, alone or in combination.
(D) Left panel: purified GST-EZH2 was incubated with purified His-ZRANB1, followed by pull-down with nickel beads and immunoblotting with antibodies against EZH2 and ZRANB1. Right panel: purified recombinant proteins were analyzed by SDS-PAGE and Coomassie blue staining.
(E) Immunoblotting of EZH2, SUZ12, EED, ZRANB1, H3K27me1, H3K27me2, H3K27me3, H3, and β-actin in two independent clones of ZRANB1-knockout HEK293A cells generated by CRISPR-Cas9.
(F) Co-immunoprecipitation (coIP) of endogenous EZH2 with endogenous ZRANB1, SUZ12, and EED. EZH2 was immunoprecipitated from HEK293T cells, followed by immunoblotting with antibodies against ZRANB1, EZH2, SUZ12, and EED.
(G) Heatmap of 63 genes that were identified by RNA-seq analysis to be commonly upregulated (49 genes) or commonly downregulated (14 genes) in ZRANB1-knockdown and EZH2-knockdown LM2 cells. Threshold values are as follows: corrected p value < 0.05 and absolute log2 fold change (log2FC) > 0.7. Genes are shown in rows and samples are shown in columns. n = 3 samples per group.
(H) Venn diagrams of all genes that were identified by RNA-seq analysis to be upregulated (upper panel) or downregulated (lower panel) in ZRANB1-knockdown (blue) or EZH2-knockdown (pink) LM2 cells. Threshold values are as follows: corrected p value < 0.05 and absolute log2 fold change (log2FC) > 0.7. n = 3 samples per group. Additional information is available in Table S1.
See also Figures S1 and S2.

