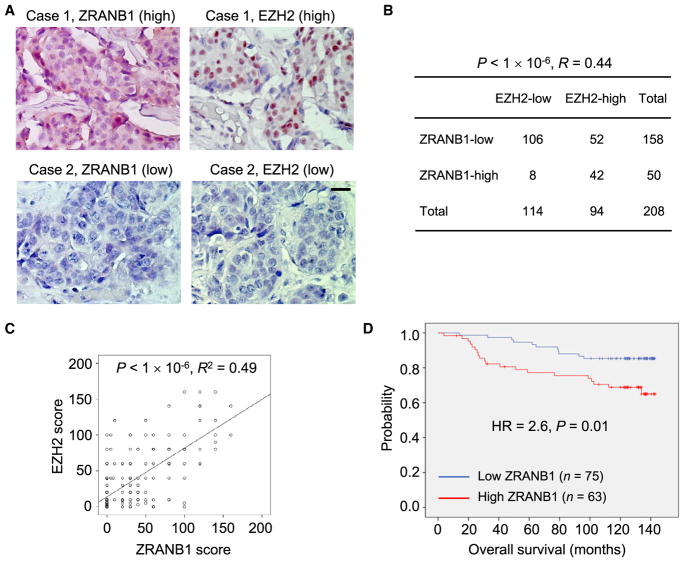
Figure 7. ZRANB1 Levels Correlate with EZH2 Levels and Poor Survival in Human Breast Cancer.
(A) Immunohistochemical staining of ZRANB1 and EZH2 in representative breast tumor specimens. Scale bar, 50 μm.
(B) Correlation between ZRANB1 and EZH2 protein levels in human breast tumors. The p value was calculated from a chi-square test. R is the Spearman correlation coefficient.
(C) ZRANB1 protein scores (x axis) in primary breast tumors positively correlate with EZH2 protein scores (y axis) in individual patients. The p value was calculated from a linear regression analysis. R is the correlation coefficient. Protein score = the percentage of immunopositive cells × immunostaining intensity.
(D) Kaplan-Meier curves of overall survival of breast cancer patients (n = 138 patients), stratified by ZRANB1 protein levels. Protein score = the percentage of immunopositive cells × immunostaining intensity. High or low protein expression was defined using the mean score of all samples as a cutoff point. The p value was calculated from a log rank test. HR, hazard ratio.
See also Figure S7.

